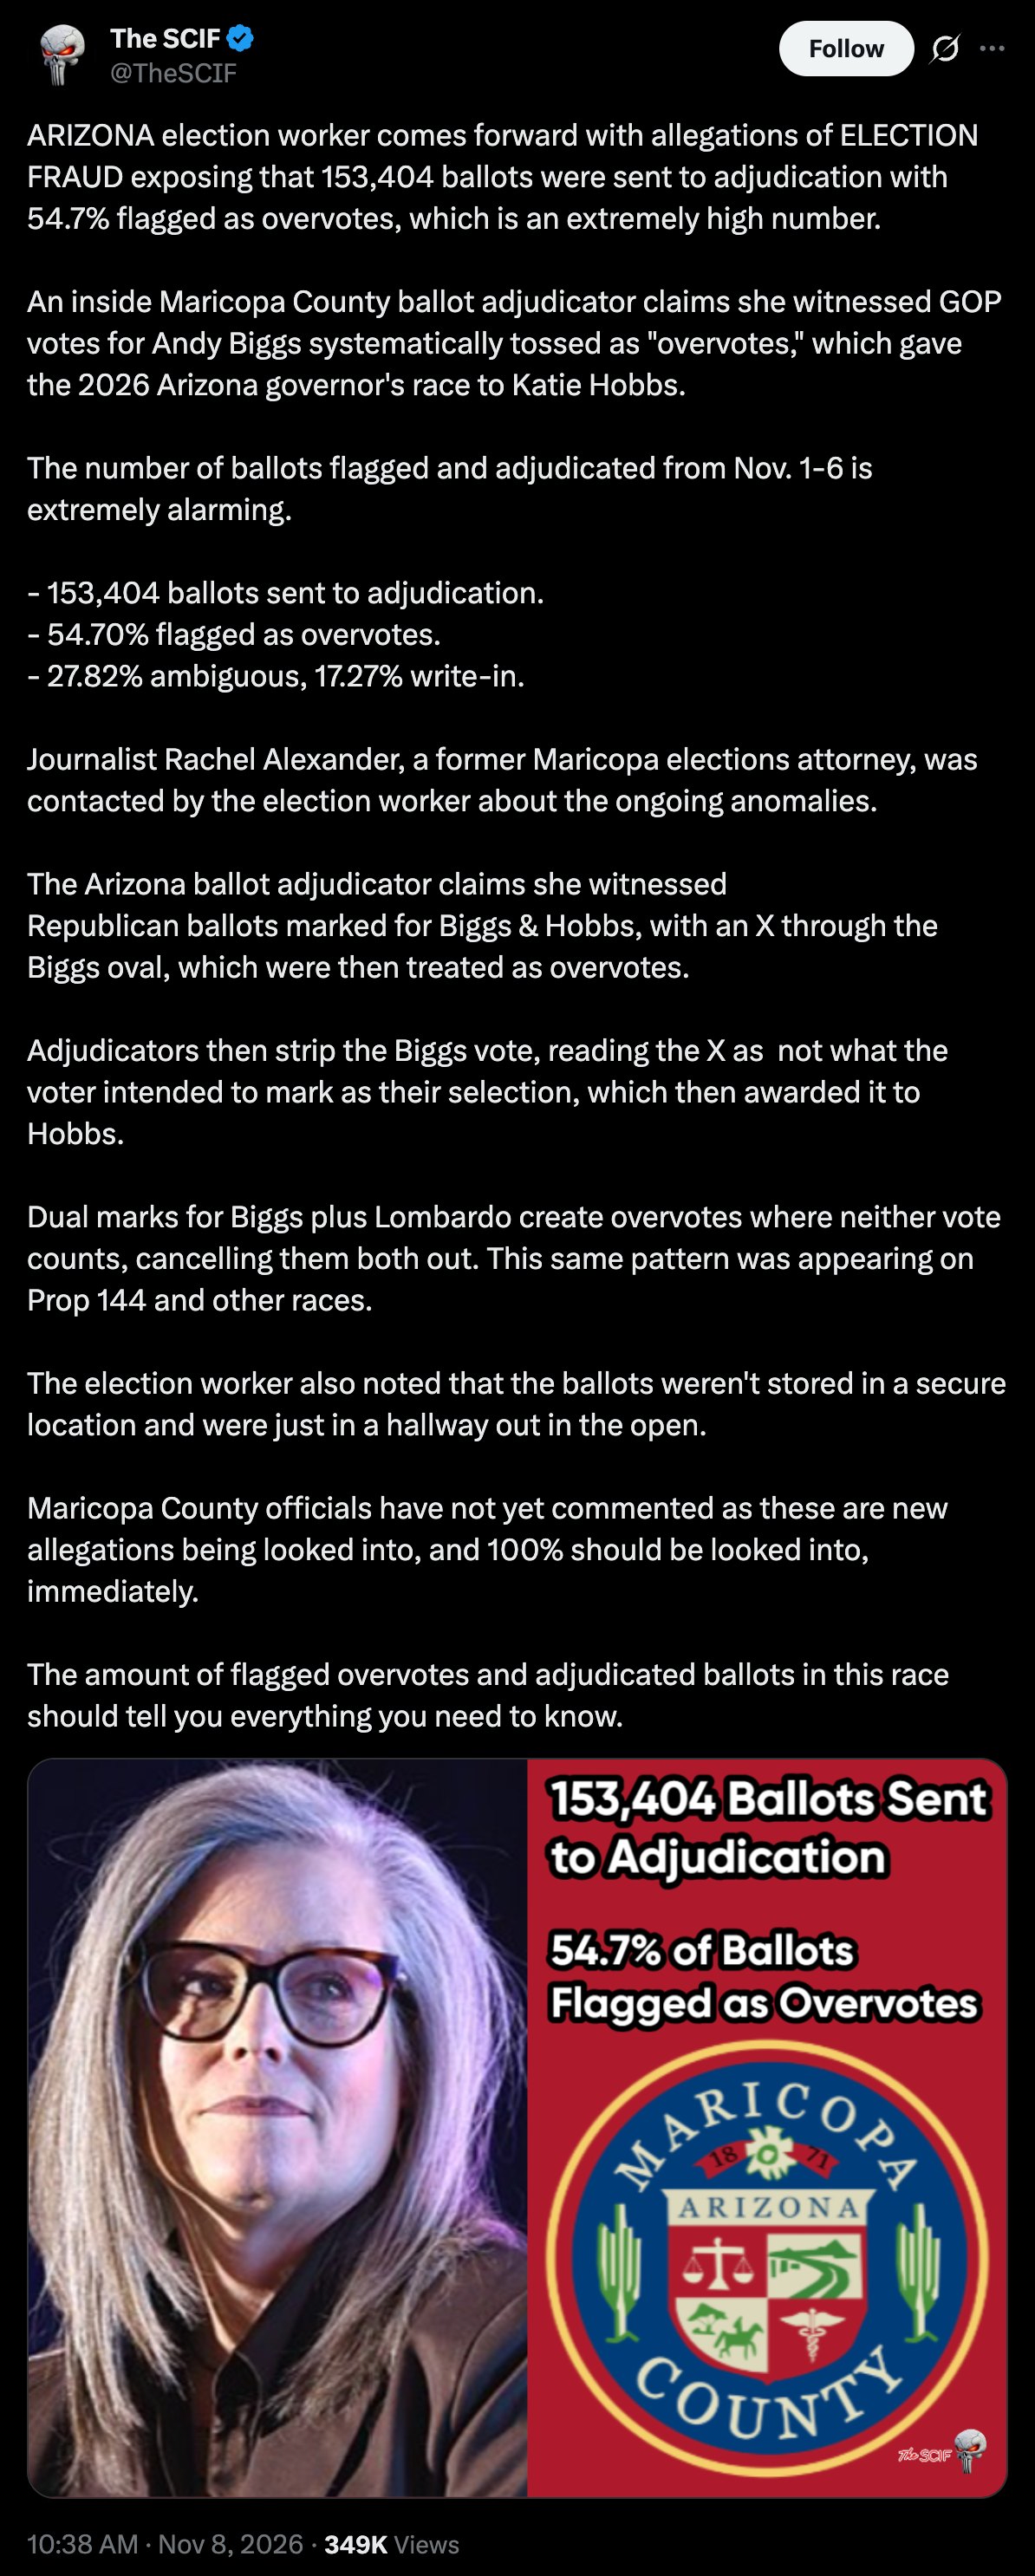
Even if the image is real, its own Nov. 1–6 rows total 56,477, not 153,404. And 153,404 would be about 9.8% of ballots, below 2020's 11.3%. No one has verified it.
The numbers trace to one image an unnamed adjudicator showed journalist Rachel Alexander1. It is cropped at the top and bottom. Its visible rows, Nov. 1 through Nov. 6, add up to 56,477 by our calculation, so the 153,404 must cover more than those six days, likely rows cut off above Nov. 1. Sites repeating the claim say it hasn't been independently verified2,3.
Any contest a scanner can't read sends a ballot to a bipartisan team4. Maricopa ballots averaged "over 80 contests" in 20245. In 2020 the county adjudicated 235,392 ballots, 11.3%6. Only 11,954 involved the presidential race, an unofficial bipartisan review of the county's cast-vote record found7.
If real, 153,404 is about 9.8% of the 1,559,706 voters in the county's final results, by our calculation8. As a baseline for the 54.7%: in 2020, 103,191 adjudicated ballots, 43.8% of those reviewed by our calculation (4.9% of all ballots), needed no change and counted as an overvote, blank or stray mark. Those categories overlap6. We found no county totals for 2022 or 2024.