Elections

Democrats' House gain looks closer to 15 million than 20

A viral chart assumed only 85% of the vote was counted. The real gain is smaller, and exit polls show who cast it.

· @kevinnbass · on XThe post we're checking
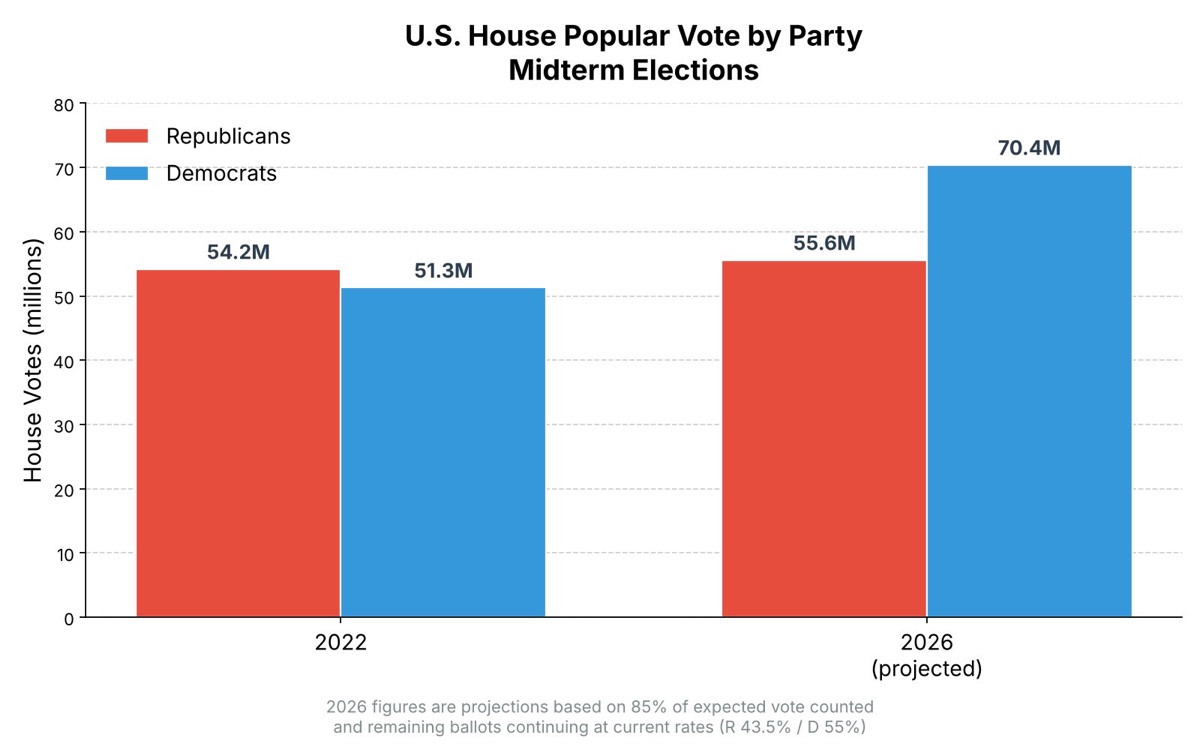
Republican votes stayed the same.

Democrats materialized 20 million new votes.

[Attached bar chart titled "U.S. House Popular Vote by Party, Midterm Elections": 2022, Republicans 54.2M and Democrats 51.3M; 2026 (projected), Republicans 55.6M and Democrats 70.4M. Footnote: "2026 figures are projections based on 85% of expected vote counted and remaining ballots continuing at current rates (R 43.5% / D 55%)".
Chart posted by @kevinnbass on X. Shown for commentary.
Read the post as text
Republican votes stayed the same. Democrats materialized 20 million new votes. [Attached bar chart titled "U.S. House Popular Vote by Party, Midterm Elections": 2022, Republicans 54.2M and Democrats 51.3M; 2026 (projected), Republicans 55.6M and Democrats 70.4M. Footnote: "2026 figures are projections based on 85% of expected vote counted and remaining ballots continuing at current rates (R 43.5% / D 55%)".]
Posted Nov 5, 2026About 2.9M views and 56.6K likes on X as of Nov. 6 (read via fxtwitter). @TrumpDailyPosts (350K views) and @BrightInsight6 (271K) shared the chart or its numbers.See the original

The bottom line

So far, Democrats have about 10.8 million more House votes than in 2022, and Republicans about 6 million fewer. Our projection from turnout estimates puts the final Democratic gain near 15 million. The chart's 20 million rested on an 85%-counted premise that implies more House votes than ballots cast. Exit polls trace the swing mostly to 2024 voters.

The claims

What the post says or clearly implies, checked one by one. How verdicts work

1

Republican House votes "stayed the same" as in 2022.

Misleading

Republicans did fall far less than Democrats rose. But they're about 6 million short of 2022 so far, likely about 3 million at the end. And 2022 was a strong year for them. They're 35% below 2024.

The post's 2022 numbers are right: 54,227,992 Republican and 51,280,463 Democratic House votes, per the Clerk of the House1. As of 7:15 a.m. ET Friday, Cook Political Report's tracker had Republicans at 48,254,756 and Democrats at 62,073,6772. The Clerk leaves fusion-party lines, such as New York's Conservative Party, out of each party's total. Cook may count them, which could shift each gap by a few hundred thousand votes.

Republicans won the 2022 House vote by 2.7 points, with 50.0% of it, by our calculation1. So far in 2026 they have 43.1%2. In 2024 their House candidates got 74,390,864 votes3, about 26 million more than they have now. Today's count is 35% below that, by our calculation.

2

Democrats got about 20 million more House votes than in 2022.

Wrong

Democrats are up 10.8 million so far, and our projection from turnout estimates puts the final gain near 15 million. The 20 million rests on assuming 85% was counted, which implies more House votes than ballots cast.

The chart's footnote implies Democrats had about 59.8 million counted when it was posted, 8.6 million above 2022, and about 128 million House votes in the end, by our calculation. Michael McDonald, whose UF Election Lab publishes the turnout estimate, put ballots cast at 124.3 million on Nov. 44. The lab's Nov. 5 update is 122.7 million5. In 2022, House races drew 108.4 million votes from 112.0 million ballots1,6.

Cook's count is 112.0 million2. If House votes end at 96.8% of the lab's 122.7 million ballots, as in 2022, about 7 million remain. Split the way the post assumes, Democrats would finish 14.5 to 14.8 million above 2022, and Republicans 2.8 to 3.0 million below, by our calculation.

The upper end adds the half-million gap between the lab's California estimate and the state's own count of processed and pending ballots5,7. California leans Democratic and is still receiving mail, so the gain could run higher. PolitiFact rated a 2024 mirror claim, that 20 million Democratic votes "disappeared," Pants on Fire. It also compared totals mid-count8.

3

The extra Democratic votes "materialized."

Wrong

The post doesn't say fraud, but many read it that way. The votes came mostly from 2024 voters, including Trump voters who switched. No official or court has alleged fraud on this scale. Nor has any losing candidate we found.

Bass's follow-up says Republicans "stuck to their guns" and crossover didn't rise9. Accounts sharing his numbers went further. @TrumpDailyPosts called them "major red flags"10, and @BrightInsight6 asked, "Where are the calls for an audit?"11 AP reported that Trump said he'd accept the results and that there was "no day-after wave of court actions"12.

Democratic House candidates got 70,571,330 votes in 20243, and Kamala Harris got 75,017,61313. The 62.1 million so far, and even the chart's 70.4 million, fit inside that pool. Democrats' House vote rose 25 million from 2014 to 2018, a bigger midterm jump than this one14,15.

In NBC News's exit poll, Harris voters were 49% of 2026 voters and Trump voters 44%, though Trump won 202416. Trump voters backed Democrats 7% to 91%. Republican crossover barely moved, from 5% for Harris to 6% for House Democrats, as Bass says17,18,16. But Republicans fell from 35% of voters to 32%, and independents went from Harris by 3 for president to House Democrats by 2018,16.
Republicans' House vote fell far more than Democrats' after 2024

010M20M30M40M50M60M70M80M20142015201620172018201920202021202220232024202520262018: 50,467,1812022: 54,227,9922024: 74,390,8642026, partial: 48,254,756

50 states. Clerk totals count votes on the Republican line and leave out fusion lines such as New York's Conservative Party. 2026 is Cook's unofficial running count, which may count fusion lines differently.

Votes for each party's House candidates, from the Clerk of the House's official statistics14,30,15,31,1,3. 2026 is Cook Political Report's partial, unofficial count as read at 7:15 a.m. ET Nov. 62, with millions of ballots still uncounted.
Show the numbers
Republicans' House vote fell far more than Democrats' after 2024: the numbers
YearRepublican House votesDemocratic House votes
201439,926,52635,368,840
201662,772,22561,417,454
201850,467,18160,319,623
202072,466,57677,122,690
202254,227,99251,280,463
202474,390,86470,571,330
202648,254,75662,073,677

The real disagreement

Facts can't settle this part, so we don't rule on it.

Should people have to show documents proving citizenship to register to vote, if that makes the rolls easier to trust but harder for some citizens to sign up?

@TrumpDailyPosts, sharing the chart's numbers, asked "why were so many citizenship not verified"10. State audits find noncitizens on the rolls in the dozens to hundreds, far too few to move a national count by millions19,20,21. Congress has fought over proof of citizenship for more than two years. The House passed the SAVE Act, 220-208, in April 202522 and the SAVE America Act, 218-213, in February. Neither has passed the Senate. It took up the second in March, but a 53-47 vote to end debate on a photo-ID amendment fell short of the 60 needed, and the bill hasn't moved since23. A federal judge ruled that President Trump couldn't require the proof on the federal registration form by executive order24.

Require documents at registration

A one-time citizenship check at the front door is the surest way to keep the rolls clean and get the losing side to trust the count.

Audits keep finding noncitizens on the rolls. Louisiana's preliminary check against a federal database flagged 390 suspected noncitizens on the rolls, 79 of whom had voted at some point since the 1980s19. In Utah, 34 of the confirmed or probable noncitizens had checked "Yes" on the citizenship statement20. The oath didn't stop them. "Every illegal vote counts against a legal vote," said Louisiana state Sen. Caleb Kleinpeter19.

Checking at registration works. Most of the nine noncitizen voters Georgia found in 2024 voted before the state began verifying citizenship through driver's-license records in 201225. Utah now asks the 5,007 registrants it couldn't confirm for proof, or they get a federal-only ballot20. The SAVE Act lets applicants without papers offer other evidence under oath26. And 83% of Americans, including 66% of Democrats, favored proof of citizenship for first-time registrants in 202427.

Check records, not paperwork

Database checks already catch the rare noncitizen. Making every applicant produce a birth certificate or passport shuts out far more citizens.

When Kansas required documents, 31,089 applicants were blocked from registering. The trial court found, and the appeals court upheld, that more than 99% of those suspended were citizens, against 39 confirmed noncitizens registered over 14 years28. About 21.3 million voting-age citizens, 9.1%, lack ready access to such papers29. The SAVE Act would make mail registrants bring them "in person to the office of the appropriate election official"26.

Records checks find the rare cases without that cost. Utah's review, finished in May, checked 2,069,640 voter records, confirmed 27 noncitizens and flagged 25 more as probable20. Georgia, which checks more than 98% of registrations against driver's-license data at signup, found 432 potential noncitizens who had voted at some point since 1996, on a list of nearly 7.9 million21. Ask for papers only when the databases can't confirm someone.

Where they agree

  • Only citizens may vote in federal elections, and both sides want noncitizens found and removed from the rolls.
  • Both sides support checking registrations against government records such as driver's-license and federal immigration data.

What would change minds

  • A national review like Utah's, matching every state's rolls against citizenship records, would show how many noncitizens are registered and how many have voted.
  • Counts from states that adopt document requirements of how many eligible citizens fail to register, and why, would show the real cost.

Sources

Every source was opened and read. Advocacy groups are labeled as such.

Show all 31 sources
  1. 1
    Statistics of the Congressional Election of November 8, 2022
    Clerk of the U.S. House of Representatives2023-02-28DataPDF. National totals: Republican 54,227,992, Democratic 51,280,463, all candidates 108,443,387.
  2. 2
    2026 House Vote Tracker
    Cook Political Report2026-11-06DataLive, unofficial running count, updated until all 50 states certify. Figures here as read at 7:15 a.m. ET Nov. 6.
  3. 3
    Statistics of the Presidential and Congressional Election of November 5, 2024
    Clerk of the U.S. House of Representatives2025-03-10DataPDF. National House totals are in the "Recapitulation of Votes Cast for United States Representatives" table.
  4. 4
    Preliminary 2026 Turnout Rate
    Michael McDonald (University of Florida), on Substack2026-11-04ResearchUF professor who produces the UF Election Lab's turnout data. The lab updated this estimate to 122.7 million on Nov. 5.
  5. 5
    2026 General Election Turnout, data v0.2 (initial estimate)
    University of Florida Election Lab2026-11-05DataCSV. Estimated ballots cast nationwide: 122,683,000. Estimates until states certify.
  6. 6
    2022 General Election Turnout, data v1.2
    University of Florida Election LabDataCSV. Ballots counted nationwide: 112,030,874.
  7. 7
    Unprocessed Ballots Status, Nov. 3, 2026 General Election
    California Secretary of State2026-11-05DataLive page. Cited as of its 6:15 p.m. Nov. 5 report: 4,816,722 ballots estimated remaining statewide.
  8. 8
  9. 9
    Follow-up post: "There was no increased crossover vote"
    Kevin Bass (@kevinnbass) on X2026-11-05Primary document
  10. 10
    Post comparing 2022 and 2026 House vote totals
    @TrumpDailyPosts on X2026-11-05Primary document
  11. 11
    Post: "Where are the calls for an audit?"
    @BrightInsight6 on X2026-11-05Primary document
  12. 12
    Fact check: False claims of rigged elections are limited as midterm vote heavily favors Democrats
    Associated Press (Melissa Goldin and Calvin Woodward), via Sentinel Colorado2026-11-05Journalism
  13. 13
    2024 Presidential General Election Results
    Federal Election Commission2025Data
  14. 14
    Statistics of the Congressional Election of November 4, 2014
    Clerk of the U.S. House of Representatives2015DataPDF. National House totals are in the "Recapitulation of Votes Cast for United States Representatives" table.
  15. 15
    Statistics of the Congressional Election of November 6, 2018
    Clerk of the U.S. House of Representatives2019-02-28DataPDF. National House totals are in the "Recapitulation of Votes Cast for United States Representatives" table.
  16. 16
    2026 national exit polls
    NBC News2026-11-04DataSurvey of voters by SSRS for a consortium of news organizations, weighted to results and updated as counting goes on. Figures as of the Nov. 4, 10:52 p.m. ET update.
  17. 17
    Follow-up post on exit-poll crossover
    Kevin Bass (@kevinnbass) on X2026-11-06Primary document
  18. 18
  19. 19
  20. 20
    Utah Voter Registration Citizenship Review
    Office of the Utah Lieutenant Governor2026-05-27Primary document
  21. 21
    State Audit Proves Georgia is National Leader in Clean Voter Lists
    Georgia Secretary of State2026-09-01Primary document
  22. 22
    H.R.22, SAVE Act: All actions
    Congress.gov2025-04-10Primary document
  23. 23
    S.1383: All actions (carries the House-passed SAVE America Act)
    Congress.gov2026-03-26Primary documentThe House passed the SAVE America Act 218-213 on Feb. 11, 2026, as an amendment to this Senate bill. On March 26 the Senate failed, 53-47, to end debate on amendment SA 4732; no action since.
  24. 24
  25. 25
  26. 26
    H.R.22, SAVE Act: Text as passed by the House
    Congress.gov2025-04-10Primary document
  27. 27
  28. 28
    Fish v. Schwab, No. 18-3133 (opinion)
    U.S. Court of Appeals for the Tenth Circuit (copy hosted by Washburn University School of Law)2020-04-29Primary document
  29. 29
    21.3 Million American Citizens of Voting Age Don't Have Ready Access to Citizenship Documents
    Brennan Center for Justice2024-06-11Advocacy / think tankVoting-rights think tank at NYU Law, generally left-leaning. Survey fielded by SSRS in 2023 with VoteRiders and the University of Maryland.
  30. 30
    Statistics of the Presidential and Congressional Election of November 8, 2016
    Clerk of the U.S. House of Representatives2017DataPDF. National House totals are in the "Recapitulation of Votes Cast for United States Representatives" table.
  31. 31
    Statistics of the Presidential and Congressional Election of November 3, 2020
    Clerk of the U.S. House of Representatives2021DataPDF. National House totals are in the "Recapitulation of Votes Cast for United States Representatives" table.

Think we got something wrong? Email editor@viewfromthegallery.com with a source. Corrections are made openly and logged on the page.