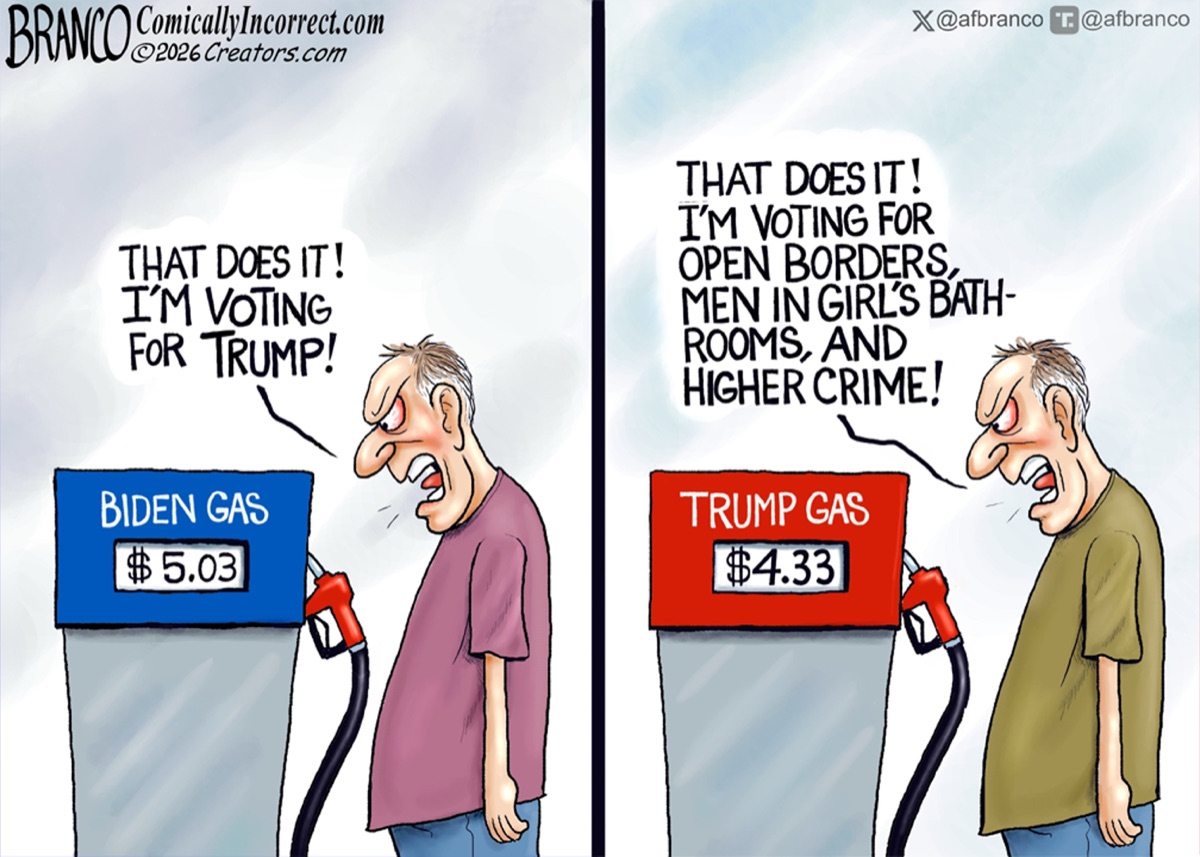
Biden gas $5.03, Trump gas $4.33: both real, not a fair comparison
Averaged over each term so far, gas has cost about the same under both presidents. We also check the cartoon's border and crime lines.
The bottom line
- Checks out$5.03 and $4.33
- MisleadingCheaper under Trump
- MisleadingDemocrats mean open borders
- MisleadingDemocrats mean more crime
Both pump prices are real, but $5.03 was a brief record. Over each term, gas averaged about the same. Adjusted for inflation, Biden's years cost more. Border crossings set records under Biden, fell under his 2024 limits and further under Trump's. Violent crime is down, and was already falling. The real fight: how much should the pump decide a vote?
Make your own gas-price cartoon
The claims
What the post says or clearly implies, checked one by one. How verdicts work
Gas hit $5.03 a gallon under Biden and was $4.33 under Trump this month.
Checks outBoth are real national averages. $5.03 was GasBuddy's one-day record, on June 14, 2022, and gas stayed at $5 or more for about a week. $4.33 was EIA's average on Oct. 12. It's about $4.27 now.
GasBuddy's national average peaked at $5.03 on June 14, 20221. AAA's record that day was $5.01652, and EIA's weekly survey topped out at $5.0063. Crude oil was above $120 a barrel after Russia's full-scale invasion of Ukraine4,5, and gas stayed at or above $5 for about one week6.
EIA had regular gas at $4.331 on Oct. 12 and $4.284 on Oct. 19, and $4.269 on Oct. 267. AAA's average was $4.27 on Oct. 272. Gas was about $3.11 the morning Biden left office, fell to $2.78 in January 2026, and has peaked so far at $4.50 in May 20263.
This year's jump came after the U.S. war with Iran, now nearly eight months old, disrupted oil shipments through the Strait of Hormuz8. Before the conflict, EIA expected 2026 gas to average $2.91. It now expects $3.919,10.
Gas is cheaper under Trump than it was under Biden.
MisleadingIt pits Biden's brief record against a recent Trump-era price. Full-term averages are nearly tied at the pump, and lower under Trump after inflation. At the same point in each term, gas is about 40 cents higher now.
By our calculation from EIA's weekly data, gas averaged $3.456 a gallon under Biden and $3.458 so far under Trump. In the same week of each term, it was $3.87 (Oct. 17, 2022) and $4.28 (Oct. 19, 2026). Only 13 of Biden's 209 weeks topped that $4.28, all from March to July 20223. CNN, counting daily AAA prices against Oct. 12's $4.36, found 76 of Biden's 1,460 days higher5.
Adjusted for inflation, the picture tilts the other way: in today's dollars, Biden's peak was about $5.71 and his term average about $3.93, versus $4.53 and $3.55 under Trump so far. That week, adjusted prices were a bit higher under Biden: $4.37 then, $4.28 now3,11.
CNN's Oct. 26 headline, "Gas under Trump 2.0 is now more expensive than it was under Biden," uses full terms and AAA data but gives no averages8. On EIA's data the averages differ by less than a penny, and adjusted for inflation Biden's term cost more. By the same standard, that headline is misleading too: a near-tie sold as a win.
Both prices are real. At the pump, term averages are nearly tied.
Show the numbers
| Date | Pump price | In today's dollars |
|---|---|---|
| Jan. 4, 2021 | $2.25 | $2.88 |
| Jan. 11, 2021 | $2.32 | $2.97 |
| Jan. 18, 2021 | $2.38 | $3.05 |
| Jan. 25, 2021 | $2.39 | $3.06 |
| Feb. 1, 2021 | $2.41 | $3.07 |
| Feb. 8, 2021 | $2.46 | $3.14 |
| Feb. 15, 2021 | $2.50 | $3.19 |
| Feb. 22, 2021 | $2.63 | $3.36 |
| March 1, 2021 | $2.71 | $3.44 |
| March 8, 2021 | $2.77 | $3.52 |
| March 15, 2021 | $2.85 | $3.62 |
| March 22, 2021 | $2.87 | $3.64 |
| March 29, 2021 | $2.85 | $3.62 |
| April 5, 2021 | $2.86 | $3.60 |
| April 12, 2021 | $2.85 | $3.59 |
| April 19, 2021 | $2.85 | $3.60 |
| April 26, 2021 | $2.87 | $3.62 |
| May 3, 2021 | $2.89 | $3.62 |
| May 10, 2021 | $2.96 | $3.71 |
| May 17, 2021 | $3.03 | $3.79 |
| May 24, 2021 | $3.02 | $3.78 |
| May 31, 2021 | $3.03 | $3.79 |
| June 7, 2021 | $3.04 | $3.77 |
| June 14, 2021 | $3.07 | $3.81 |
| June 21, 2021 | $3.06 | $3.80 |
| June 28, 2021 | $3.09 | $3.84 |
| July 5, 2021 | $3.12 | $3.86 |
| July 12, 2021 | $3.13 | $3.88 |
| July 19, 2021 | $3.15 | $3.90 |
| July 26, 2021 | $3.14 | $3.88 |
| Aug. 2, 2021 | $3.16 | $3.90 |
| Aug. 9, 2021 | $3.17 | $3.91 |
| Aug. 16, 2021 | $3.17 | $3.92 |
| Aug. 23, 2021 | $3.15 | $3.88 |
| Aug. 30, 2021 | $3.14 | $3.87 |
| Sept. 6, 2021 | $3.18 | $3.90 |
| Sept. 13, 2021 | $3.17 | $3.89 |
| Sept. 20, 2021 | $3.18 | $3.91 |
| Sept. 27, 2021 | $3.17 | $3.90 |
| Oct. 4, 2021 | $3.19 | $3.88 |
| Oct. 11, 2021 | $3.27 | $3.97 |
| Oct. 18, 2021 | $3.32 | $4.04 |
| Oct. 25, 2021 | $3.38 | $4.11 |
| Nov. 1, 2021 | $3.39 | $4.09 |
| Nov. 8, 2021 | $3.41 | $4.11 |
| Nov. 15, 2021 | $3.40 | $4.10 |
| Nov. 22, 2021 | $3.40 | $4.09 |
| Nov. 29, 2021 | $3.38 | $4.08 |
| Dec. 6, 2021 | $3.34 | $4.00 |
| Dec. 13, 2021 | $3.31 | $3.97 |
| Dec. 20, 2021 | $3.29 | $3.95 |
| Dec. 27, 2021 | $3.27 | $3.92 |
| Jan. 3, 2022 | $3.28 | $3.90 |
| Jan. 10, 2022 | $3.29 | $3.92 |
| Jan. 17, 2022 | $3.31 | $3.94 |
| Jan. 24, 2022 | $3.32 | $3.96 |
| Jan. 31, 2022 | $3.37 | $4.01 |
| Feb. 7, 2022 | $3.44 | $4.07 |
| Feb. 14, 2022 | $3.49 | $4.12 |
| Feb. 21, 2022 | $3.53 | $4.17 |
| Feb. 28, 2022 | $3.61 | $4.26 |
| March 7, 2022 | $4.10 | $4.79 |
| March 14, 2022 | $4.32 | $5.04 |
| March 21, 2022 | $4.24 | $4.96 |
| March 28, 2022 | $4.23 | $4.95 |
| April 4, 2022 | $4.17 | $4.86 |
| April 11, 2022 | $4.09 | $4.77 |
| April 18, 2022 | $4.07 | $4.74 |
| April 25, 2022 | $4.11 | $4.79 |
| May 2, 2022 | $4.18 | $4.83 |
| May 9, 2022 | $4.33 | $5.00 |
| May 16, 2022 | $4.49 | $5.18 |
| May 23, 2022 | $4.59 | $5.30 |
| May 30, 2022 | $4.62 | $5.34 |
| June 6, 2022 | $4.88 | $5.56 |
| June 13, 2022 | $5.01 | $5.71 |
| June 20, 2022 | $4.96 | $5.66 |
| June 27, 2022 | $4.87 | $5.55 |
| July 4, 2022 | $4.77 | $5.44 |
| July 11, 2022 | $4.65 | $5.30 |
| July 18, 2022 | $4.49 | $5.12 |
| July 25, 2022 | $4.33 | $4.94 |
| Aug. 1, 2022 | $4.19 | $4.78 |
| Aug. 8, 2022 | $4.04 | $4.60 |
| Aug. 15, 2022 | $3.94 | $4.49 |
| Aug. 22, 2022 | $3.88 | $4.42 |
| Aug. 29, 2022 | $3.83 | $4.36 |
| Sept. 5, 2022 | $3.75 | $4.25 |
| Sept. 12, 2022 | $3.69 | $4.19 |
| Sept. 19, 2022 | $3.65 | $4.15 |
| Sept. 26, 2022 | $3.71 | $4.21 |
| Oct. 3, 2022 | $3.78 | $4.27 |
| Oct. 10, 2022 | $3.91 | $4.42 |
| Oct. 17, 2022 | $3.87 | $4.37 |
| Oct. 24, 2022 | $3.77 | $4.25 |
| Oct. 31, 2022 | $3.74 | $4.22 |
| Nov. 7, 2022 | $3.80 | $4.27 |
| Nov. 14, 2022 | $3.76 | $4.23 |
| Nov. 21, 2022 | $3.65 | $4.11 |
| Nov. 28, 2022 | $3.53 | $3.98 |
| Dec. 5, 2022 | $3.39 | $3.81 |
| Dec. 12, 2022 | $3.24 | $3.65 |
| Dec. 19, 2022 | $3.12 | $3.51 |
| Dec. 26, 2022 | $3.09 | $3.48 |
| Jan. 2, 2023 | $3.22 | $3.61 |
| Jan. 9, 2023 | $3.26 | $3.65 |
| Jan. 16, 2023 | $3.31 | $3.71 |
| Jan. 23, 2023 | $3.42 | $3.82 |
| Jan. 30, 2023 | $3.49 | $3.91 |
| Feb. 6, 2023 | $3.44 | $3.84 |
| Feb. 13, 2023 | $3.39 | $3.78 |
| Feb. 20, 2023 | $3.38 | $3.77 |
| Feb. 27, 2023 | $3.34 | $3.73 |
| March 6, 2023 | $3.39 | $3.78 |
| March 13, 2023 | $3.46 | $3.85 |
| March 20, 2023 | $3.42 | $3.81 |
| March 27, 2023 | $3.42 | $3.81 |
| April 3, 2023 | $3.50 | $3.88 |
| April 10, 2023 | $3.60 | $3.99 |
| April 17, 2023 | $3.66 | $4.07 |
| April 24, 2023 | $3.66 | $4.06 |
| May 1, 2023 | $3.60 | $3.99 |
| May 8, 2023 | $3.53 | $3.92 |
| May 15, 2023 | $3.54 | $3.92 |
| May 22, 2023 | $3.53 | $3.92 |
| May 29, 2023 | $3.57 | $3.96 |
| June 5, 2023 | $3.54 | $3.92 |
| June 12, 2023 | $3.60 | $3.98 |
| June 19, 2023 | $3.58 | $3.96 |
| June 26, 2023 | $3.57 | $3.95 |
| July 3, 2023 | $3.53 | $3.89 |
| July 10, 2023 | $3.55 | $3.92 |
| July 17, 2023 | $3.56 | $3.93 |
| July 24, 2023 | $3.60 | $3.97 |
| July 31, 2023 | $3.76 | $4.15 |
| Aug. 7, 2023 | $3.83 | $4.21 |
| Aug. 14, 2023 | $3.85 | $4.23 |
| Aug. 21, 2023 | $3.87 | $4.25 |
| Aug. 28, 2023 | $3.81 | $4.19 |
| Sept. 4, 2023 | $3.81 | $4.17 |
| Sept. 11, 2023 | $3.82 | $4.18 |
| Sept. 18, 2023 | $3.88 | $4.24 |
| Sept. 25, 2023 | $3.84 | $4.20 |
| Oct. 2, 2023 | $3.80 | $4.15 |
| Oct. 9, 2023 | $3.68 | $4.03 |
| Oct. 16, 2023 | $3.58 | $3.91 |
| Oct. 23, 2023 | $3.53 | $3.86 |
| Oct. 30, 2023 | $3.47 | $3.80 |
| Nov. 6, 2023 | $3.40 | $3.71 |
| Nov. 13, 2023 | $3.35 | $3.65 |
| Nov. 20, 2023 | $3.29 | $3.59 |
| Nov. 27, 2023 | $3.24 | $3.53 |
| Dec. 4, 2023 | $3.23 | $3.52 |
| Dec. 11, 2023 | $3.14 | $3.42 |
| Dec. 18, 2023 | $3.05 | $3.33 |
| Dec. 25, 2023 | $3.12 | $3.39 |
| Jan. 1, 2024 | $3.09 | $3.35 |
| Jan. 8, 2024 | $3.07 | $3.34 |
| Jan. 15, 2024 | $3.06 | $3.32 |
| Jan. 22, 2024 | $3.06 | $3.33 |
| Jan. 29, 2024 | $3.10 | $3.36 |
| Feb. 5, 2024 | $3.14 | $3.39 |
| Feb. 12, 2024 | $3.19 | $3.45 |
| Feb. 19, 2024 | $3.27 | $3.54 |
| Feb. 26, 2024 | $3.25 | $3.51 |
| March 4, 2024 | $3.35 | $3.61 |
| March 11, 2024 | $3.38 | $3.63 |
| March 18, 2024 | $3.45 | $3.72 |
| March 25, 2024 | $3.52 | $3.79 |
| April 1, 2024 | $3.52 | $3.78 |
| April 8, 2024 | $3.59 | $3.86 |
| April 15, 2024 | $3.63 | $3.90 |
| April 22, 2024 | $3.67 | $3.94 |
| April 29, 2024 | $3.65 | $3.92 |
| May 6, 2024 | $3.64 | $3.91 |
| May 13, 2024 | $3.61 | $3.87 |
| May 20, 2024 | $3.58 | $3.85 |
| May 27, 2024 | $3.58 | $3.84 |
| June 3, 2024 | $3.52 | $3.78 |
| June 10, 2024 | $3.43 | $3.68 |
| June 17, 2024 | $3.44 | $3.69 |
| June 24, 2024 | $3.44 | $3.69 |
| July 1, 2024 | $3.48 | $3.73 |
| July 8, 2024 | $3.49 | $3.74 |
| July 15, 2024 | $3.50 | $3.75 |
| July 22, 2024 | $3.47 | $3.72 |
| July 29, 2024 | $3.48 | $3.74 |
| Aug. 5, 2024 | $3.45 | $3.69 |
| Aug. 12, 2024 | $3.41 | $3.66 |
| Aug. 19, 2024 | $3.38 | $3.62 |
| Aug. 26, 2024 | $3.31 | $3.55 |
| Sept. 2, 2024 | $3.29 | $3.51 |
| Sept. 9, 2024 | $3.24 | $3.46 |
| Sept. 16, 2024 | $3.18 | $3.40 |
| Sept. 23, 2024 | $3.19 | $3.40 |
| Sept. 30, 2024 | $3.18 | $3.40 |
| Oct. 7, 2024 | $3.14 | $3.34 |
| Oct. 14, 2024 | $3.17 | $3.38 |
| Oct. 21, 2024 | $3.14 | $3.35 |
| Oct. 28, 2024 | $3.10 | $3.30 |
| Nov. 4, 2024 | $3.07 | $3.26 |
| Nov. 11, 2024 | $3.05 | $3.24 |
| Nov. 18, 2024 | $3.05 | $3.24 |
| Nov. 25, 2024 | $3.04 | $3.23 |
| Dec. 2, 2024 | $3.03 | $3.21 |
| Dec. 9, 2024 | $3.01 | $3.19 |
| Dec. 16, 2024 | $3.02 | $3.19 |
| Dec. 23, 2024 | $3.02 | $3.20 |
| Dec. 30, 2024 | $3.01 | $3.18 |
| Jan. 6, 2025 | $3.05 | $3.21 |
| Jan. 13, 2025 | $3.04 | $3.21 |
| Jan. 20, 2025 | $3.11 | $3.28 |
| Jan. 27, 2025 | $3.10 | $3.27 |
| Feb. 3, 2025 | $3.08 | $3.24 |
| Feb. 10, 2025 | $3.13 | $3.29 |
| Feb. 17, 2025 | $3.15 | $3.31 |
| Feb. 24, 2025 | $3.13 | $3.29 |
| March 3, 2025 | $3.08 | $3.24 |
| March 10, 2025 | $3.07 | $3.23 |
| March 17, 2025 | $3.06 | $3.22 |
| March 24, 2025 | $3.12 | $3.28 |
| March 31, 2025 | $3.16 | $3.33 |
| April 7, 2025 | $3.24 | $3.40 |
| April 14, 2025 | $3.17 | $3.33 |
| April 21, 2025 | $3.14 | $3.30 |
| April 28, 2025 | $3.13 | $3.29 |
| May 5, 2025 | $3.15 | $3.30 |
| May 12, 2025 | $3.12 | $3.27 |
| May 19, 2025 | $3.17 | $3.33 |
| May 26, 2025 | $3.16 | $3.31 |
| June 2, 2025 | $3.13 | $3.27 |
| June 9, 2025 | $3.11 | $3.25 |
| June 16, 2025 | $3.14 | $3.28 |
| June 23, 2025 | $3.21 | $3.36 |
| June 30, 2025 | $3.16 | $3.31 |
| July 7, 2025 | $3.13 | $3.26 |
| July 14, 2025 | $3.13 | $3.27 |
| July 21, 2025 | $3.12 | $3.26 |
| July 28, 2025 | $3.12 | $3.26 |
| Aug. 4, 2025 | $3.14 | $3.27 |
| Aug. 11, 2025 | $3.12 | $3.24 |
| Aug. 18, 2025 | $3.13 | $3.25 |
| Aug. 25, 2025 | $3.15 | $3.27 |
| Sept. 1, 2025 | $3.18 | $3.29 |
| Sept. 8, 2025 | $3.19 | $3.31 |
| Sept. 15, 2025 | $3.17 | $3.29 |
| Sept. 22, 2025 | $3.17 | $3.29 |
| Sept. 29, 2025 | $3.12 | $3.23 |
| Oct. 6, 2025 | $3.12 | $3.24 |
| Oct. 13, 2025 | $3.06 | $3.17 |
| Oct. 20, 2025 | $3.02 | $3.13 |
| Oct. 27, 2025 | $3.04 | $3.14 |
| Nov. 3, 2025 | $3.02 | $3.12 |
| Nov. 10, 2025 | $3.06 | $3.16 |
| Nov. 17, 2025 | $3.06 | $3.17 |
| Nov. 24, 2025 | $3.06 | $3.17 |
| Dec. 1, 2025 | $2.98 | $3.08 |
| Dec. 8, 2025 | $2.94 | $3.03 |
| Dec. 15, 2025 | $2.90 | $2.99 |
| Dec. 22, 2025 | $2.84 | $2.93 |
| Dec. 29, 2025 | $2.81 | $2.90 |
| Jan. 5, 2026 | $2.80 | $2.88 |
| Jan. 12, 2026 | $2.78 | $2.86 |
| Jan. 19, 2026 | $2.81 | $2.89 |
| Jan. 26, 2026 | $2.85 | $2.94 |
| Feb. 2, 2026 | $2.87 | $2.94 |
| Feb. 9, 2026 | $2.90 | $2.98 |
| Feb. 16, 2026 | $2.92 | $3.00 |
| Feb. 23, 2026 | $2.94 | $3.02 |
| March 2, 2026 | $3.02 | $3.07 |
| March 9, 2026 | $3.50 | $3.57 |
| March 16, 2026 | $3.72 | $3.79 |
| March 23, 2026 | $3.96 | $4.03 |
| March 30, 2026 | $3.99 | $4.06 |
| April 6, 2026 | $4.12 | $4.17 |
| April 13, 2026 | $4.12 | $4.17 |
| April 20, 2026 | $4.04 | $4.09 |
| April 27, 2026 | $4.12 | $4.17 |
| May 4, 2026 | $4.45 | $4.48 |
| May 11, 2026 | $4.50 | $4.53 |
| May 18, 2026 | $4.49 | $4.52 |
| May 25, 2026 | $4.47 | $4.51 |
| June 1, 2026 | $4.30 | $4.35 |
| June 8, 2026 | $4.15 | $4.19 |
| June 15, 2026 | $4.05 | $4.10 |
| June 22, 2026 | $3.91 | $3.96 |
| June 29, 2026 | $3.83 | $3.87 |
| July 6, 2026 | $3.78 | $3.82 |
| July 13, 2026 | $3.85 | $3.90 |
| July 20, 2026 | $4.00 | $4.04 |
| July 27, 2026 | $4.10 | $4.14 |
| Aug. 3, 2026 | $4.08 | $4.11 |
| Aug. 10, 2026 | $4.01 | $4.03 |
| Aug. 17, 2026 | $4.05 | $4.08 |
| Aug. 24, 2026 | $4.08 | $4.11 |
| Aug. 31, 2026 | $4.07 | $4.10 |
| Sept. 7, 2026 | $4.16 | $4.16 |
| Sept. 14, 2026 | $4.32 | $4.32 |
| Sept. 21, 2026 | $4.48 | $4.48 |
| Sept. 28, 2026 | $4.46 | $4.46 |
| Oct. 5, 2026 | $4.35 | $4.35 |
| Oct. 12, 2026 | $4.33 | $4.33 |
| Oct. 19, 2026 | $4.28 | $4.28 |
| Oct. 26, 2026 | $4.27 | $4.27 |
Voting for Democrats means open borders.
MisleadingCrossings hit records under Biden, and millions were allowed in to pursue their cases. But there were also millions of expulsions and removals, apprehensions fell by more than half under his 2024 limits, and Democrats' platform backed shutdown power.
Apprehensions hit records under Biden: 249,740 in December 2023, by our sums12. Biden paused wall construction13 and ended Remain in Mexico14. By July 2024, over 5.8 million had been paroled in or allowed entry to pursue cases, including through parole programs, MPI estimates15.
Biden's administration expelled migrants over 2.5 million times under a pandemic rule15, and its fiscal 2024 removals and returns were the most since 201016. After his June 2024 asylum limits, apprehensions fell by more than half. Trump then barred asylum at the border, a bar an appeals court ruled unlawful but left standing pending appeal17,18. Apprehensions have since averaged about 7,800 a month, by our sums12. Some researchers argue forces like violence and drought matter more than policy19.
Democrats' 2024 platform, and a bipartisan bill most Senate Democrats voted to take up and Trump opposed, backed emergency power to shut down the border20,21,22. The bill made it mandatory at a weekly average of 5,000 encounters a day23. Some Democrats want ICE abolished. Many others want reforms24.
Crossings set records under Biden, then fell in 2024 and again in 2025
Show the numbers
| Month | Apprehensions |
|---|---|
| Oct. 2018 | 51,005 |
| Nov. 2018 | 51,857 |
| Dec. 2018 | 50,751 |
| Jan. 2019 | 47,979 |
| Feb. 2019 | 66,883 |
| March 2019 | 92,833 |
| April 2019 | 99,273 |
| May 2019 | 132,856 |
| June 2019 | 94,902 |
| July 2019 | 71,978 |
| Aug. 2019 | 50,684 |
| Sept. 2019 | 40,507 |
| Oct. 2019 | 35,402 |
| Nov. 2019 | 33,524 |
| Dec. 2019 | 32,853 |
| Jan. 2020 | 29,205 |
| Feb. 2020 | 30,077 |
| March 2020 | 30,389 |
| April 2020 | 16,182 |
| May 2020 | 21,593 |
| June 2020 | 30,836 |
| July 2020 | 38,536 |
| Aug. 2020 | 47,283 |
| Sept. 2020 | 54,771 |
| Oct. 2020 | 69,032 |
| Nov. 2020 | 69,169 |
| Dec. 2020 | 71,141 |
| Jan. 2021 | 75,316 |
| Feb. 2021 | 97,643 |
| March 2021 | 169,216 |
| April 2021 | 173,699 |
| May 2021 | 172,654 |
| June 2021 | 178,649 |
| July 2021 | 200,658 |
| Aug. 2021 | 196,514 |
| Sept. 2021 | 185,515 |
| Oct. 2021 | 159,113 |
| Nov. 2021 | 167,015 |
| Dec. 2021 | 170,602 |
| Jan. 2022 | 147,877 |
| Feb. 2022 | 159,170 |
| March 2022 | 211,181 |
| April 2022 | 203,504 |
| May 2022 | 224,370 |
| June 2022 | 192,399 |
| July 2022 | 181,834 |
| Aug. 2022 | 181,774 |
| Sept. 2022 | 207,597 |
| Oct. 2022 | 205,134 |
| Nov. 2022 | 207,680 |
| Dec. 2022 | 222,018 |
| Jan. 2023 | 129,513 |
| Feb. 2023 | 130,521 |
| March 2023 | 163,672 |
| April 2023 | 183,921 |
| May 2023 | 171,382 |
| June 2023 | 99,538 |
| July 2023 | 132,642 |
| Aug. 2023 | 181,054 |
| Sept. 2023 | 218,763 |
| Oct. 2023 | 188,749 |
| Nov. 2023 | 191,106 |
| Dec. 2023 | 249,740 |
| Jan. 2024 | 124,215 |
| Feb. 2024 | 140,641 |
| March 2024 | 137,473 |
| April 2024 | 128,895 |
| May 2024 | 117,905 |
| June 2024 | 83,532 |
| July 2024 | 56,400 |
| Aug. 2024 | 58,009 |
| Sept. 2024 | 53,858 |
| Oct. 2024 | 56,515 |
| Nov. 2024 | 46,609 |
| Dec. 2024 | 47,320 |
| Jan. 2025 | 29,105 |
| Feb. 2025 | 8,349 |
| March 2025 | 7,179 |
| April 2025 | 8,376 |
| May 2025 | 8,724 |
| June 2025 | 6,066 |
| July 2025 | 4,592 |
| Aug. 2025 | 6,317 |
| Sept. 2025 | 8,386 |
| Oct. 2025 | 7,987 |
| Nov. 2025 | 7,353 |
| Dec. 2025 | 6,476 |
| Jan. 2026 | 6,077 |
| Feb. 2026 | 6,599 |
| March 2026 | 8,271 |
| April 2026 | 8,969 |
| May 2026 | 10,011 |
| June 2026 | 9,856 |
| July 2026 | 9,296 |
| Aug. 2026 | 8,874 |
| Sept. 2026 | 8,936 |
Voting for Democrats means higher crime.
MisleadingViolent crime is lower now than in any Biden year, but it also fell every year from 2022 through 2024, and there's no good evidence that the party in power drives crime rates.
FBI estimates show murder down 6.1% in 2022, 11.6% in 2023 and 14.9% in 202425,26,27, then 18.1% in 2025, when violent crime had its largest one-year drop since FBI estimates began28. Big-city data show the decline continuing into 202629.
Some data cut the other way: murder rose again in 2021, after a record jump in 2020, Trump's last full year30,31, and the federal victimization survey showed violent victimization rising in 202232. But the strongest causal study, comparing cities where mayoral races were close, finds the winning party makes no difference to crime rates33. It covers mayors, not presidents.
The real disagreement
Facts can't settle this part, so we don't rule on it.
How much should a president be blamed, or credited, for what you pay at the pump?
Crude oil makes up about half the price of a gallon, and it's priced on a world market34,35. Voters' answer tends to depend on who's in office: Democrats saying a president can do a lot about gas prices fell from 71% under Bush to 42% under Obama, while Republicans rose from 54% to 69%36.
Presidents should answer for the pump
Policy moves prices by cents and war by dollars, and voters are right to judge how a president uses those levers.
Presidents can't set the price, but they hold real levers. Treasury estimated that the 2022 release from the strategic reserve cut gasoline by 17 to 42 cents a gallon37. Decisions about war and peace can matter far more: before the 2026 conflict with Iran, EIA expected gas to average $2.91 this year, and it now expects $3.919,10.
Even a few cents matter to a family that fills up every week, and the pump is the price voters feel most directly. Accountability doesn't require total control. It means judging whether a president used the margin he has well, by the same standard whichever party governs.
The pump is a poor report card
Crude is priced by the world, not the White House, so gas prices mostly reward or punish luck.
Crude is the largest part of a gallon's price34, and EIA says it is "driven by global supply and demand," moved by OPEC, wars, weather and refinery outages35. In a 2012 Chicago Booth survey, 36 of the 39 leading economists who answered agreed that a decade of gas-price changes was mainly due to market factors rather than federal policy, and none disagreed38.
The 2022 record came after Russia invaded Ukraine5. Who gets blamed tracks party more than evidence36. Grading presidents on the weekly average rewards timing, punishes whoever holds office when a shock hits, and invites quick fixes. Judge the decisions themselves on their merits instead.
Where they agree
What would change minds
- One yardstick applied to every president, such as inflation-adjusted averages over comparable stretches of each term.
- Estimates in cents per gallon of what specific decisions, like reserve releases, sanctions, permits or military action, actually did to prices.
Sources
Every source was opened and read. Advocacy groups are labeled as such.
Show all 39 sources
- 1
- 2
- 3
- 4
- 5
- 6
- 7
- 8
- 9
- 10
- 11
- 12
- 13
- 14
- 15
- 16
- 17
- 18
- 19
- 20
- 21
- 22
- 23
- 24
- 25
- 26
- 27
- 28
- 29
- 30
- 31
- 32
- 33
- 34
- 35
- 36
- 37
- 38
- 39
Think we got something wrong? Email editor@viewfromthegallery.com with a source. Corrections are made openly and logged on the page.
Get new breakdowns by email
New breakdowns in your inbox: what was true, what wasn't, and what the argument is really about. No ads, no spin.