Elections

California's races ran close, not identical. No sign of an algorithm.

A viral post says California's results match too neatly to be real. Five races nearly tied. The post misstates the outlier and the court races.

· @WallStreetApes · on XThe post we're checking
HOLY CR*P 🚨 How is this even possible??

All of California’s major candidate election results are the EXACT SAME percentages for Democrats and Republicans

Governor 64% (D) vs 35% (R)
Lieutenant Governor 64% (D) vs 35% (R)
Secretary of State 64% (D) vs 35% (R)
Controller 64% (D) vs 35% (R)
Treasurer 64% (D) vs 35% (R)
Attorney General 64% (D) vs 35% (R)
Supreme Court Justice: Joshua Groban 72% (D) vs 28% (R)
Supreme Court Justice: Kelli M. Evans 72% (D) vs 28% (R)

These don’t look like real election results, they look like a computer algorithm 

Our elections are fake

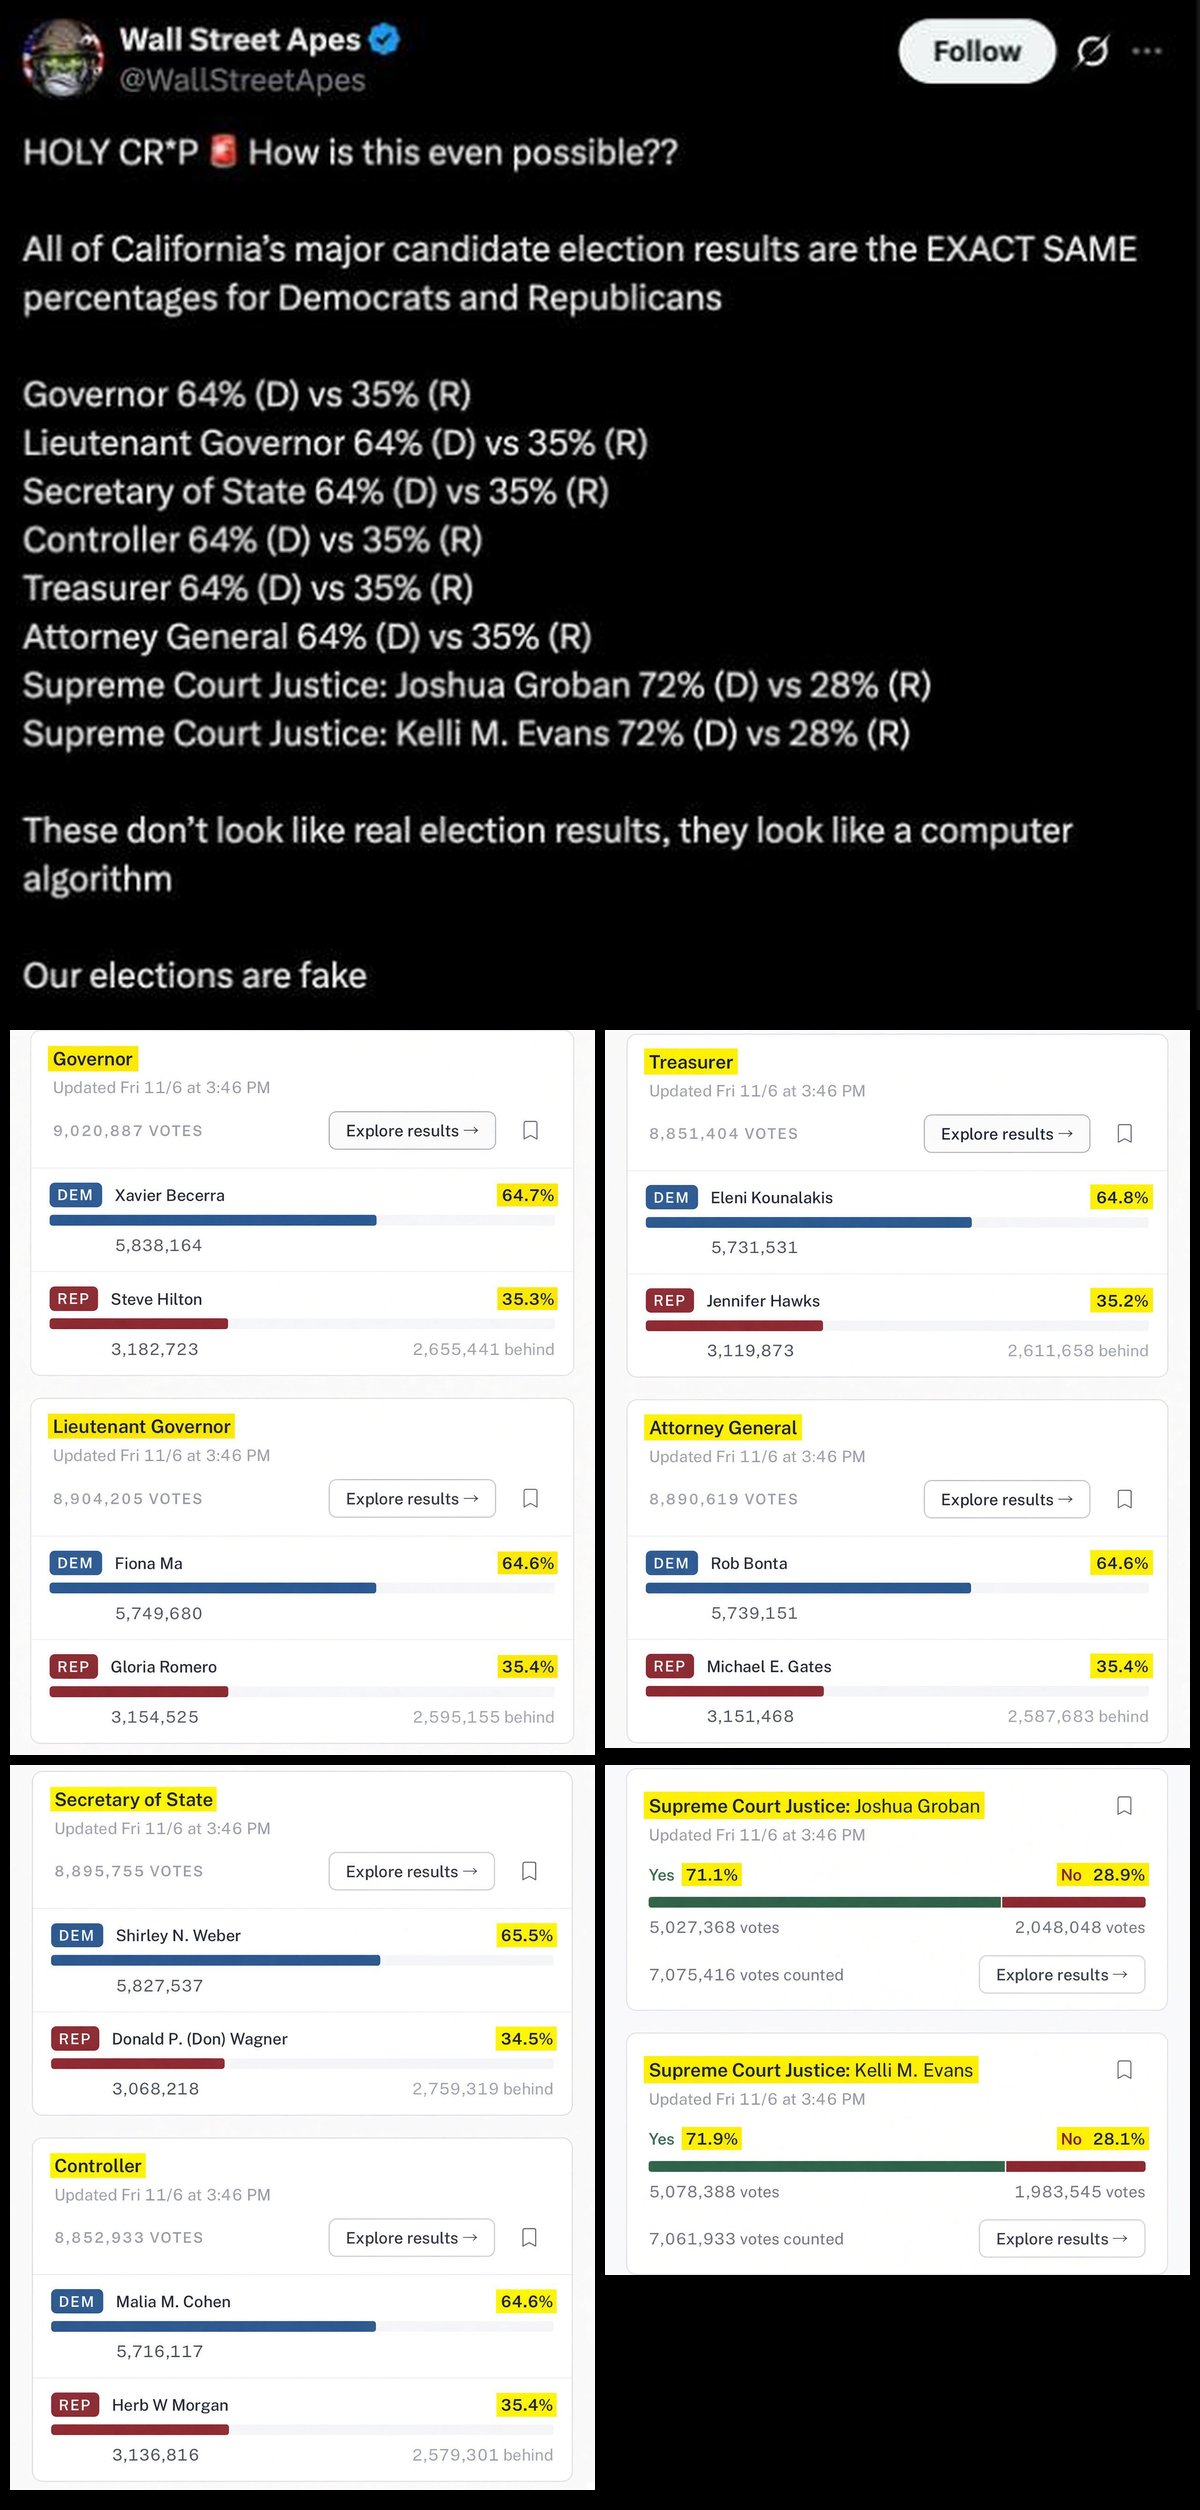
[The post attaches four screenshots of results, each marked "Updated Fri 11/6 at 3:46 PM." They show the six partisan races, with Democrats between 64.6% and 65.5%, and the two Supreme Court races, labeled "Yes" and "No" with 71.1% and 71.9% yes.
Screenshot of the post on X, with its four attached images. Shown for commentary.
Read the post as text
HOLY CR*P 🚨 How is this even possible?? All of California’s major candidate election results are the EXACT SAME percentages for Democrats and Republicans Governor 64% (D) vs 35% (R) Lieutenant Governor 64% (D) vs 35% (R) Secretary of State 64% (D) vs 35% (R) Controller 64% (D) vs 35% (R) Treasurer 64% (D) vs 35% (R) Attorney General 64% (D) vs 35% (R) Supreme Court Justice: Joshua Groban 72% (D) vs 28% (R) Supreme Court Justice: Kelli M. Evans 72% (D) vs 28% (R) These don’t look like real election results, they look like a computer algorithm Our elections are fake [The post attaches four screenshots of results, each marked "Updated Fri 11/6 at 3:46 PM." They show the six partisan races, with Democrats between 64.6% and 65.5%, and the two Supreme Court races, labeled "Yes" and "No" with 71.1% and 71.9% yes.]
Posted Nov 6, 2026About 519K views and 24K likes on X as of Nov. 7. The account has about 1.4M followers.See the original

The bottom line

Five of California's six party races stood within 0.2 points of each other as of Nov. 6, and secretary of state ran about a point ahead. The court races were yes-or-no votes with no party. That spread is tighter than in recent years, but party-line voting keeps races close, and nothing points to an algorithm.

The claims

What the post says or clearly implies, checked one by one. How verdicts work

1

California's major races all came out at the exact same percentages: 64% for the Democrat, 35% for the Republican.

Misleading

The post is right that five of the six party races nearly tied, within 0.2 points by our calculation. But it lists the outlier, Weber, at 64% though its screenshot shows 65.5%, and labels the court races by party.

As of the Secretary of State's 11 p.m. update on Nov. 6, Democrats had 65.3% for governor and 65.1% for lieutenant governor1,2. They had 65.1% for controller, 65.3% for treasurer and 65.1% for attorney general3,4,5. By our calculation from the vote counts, those five fall between 65.11% and 65.31%.

Secretary of state was the outlier, with Shirley Weber at 66.1%6. The post's own screenshots, from 3:46 p.m. that day, show the same pattern: the other five between 64.55% and 64.75%, by our calculation from the counts shown, and Weber at 65.5%. The post lists her at 64%.

The vote totals range from 9.74 million to 9.93 million, by our calculation4,1. Earlier that evening, as of 5:35 p.m., about 4 million ballots were still unprocessed7, so every figure will move.
2

The two Supreme Court races came out 72% (D) vs 28% (R).

Wrong

Supreme Court justices face yes-or-no retention votes with no party on the ballot. As of Nov. 6, Kelli Evans had 72.3% yes and Joshua Groban 71.3%.

Voters decide whether to keep each justice, "yes" or "no," and these offices are nonpartisan8. Evans led with 72.3% yes and Groban had 71.3%9. The post's own screenshot of these races shows "Yes" and "No," with Groban at 71.1%, not 72%.

Both justices worked for Democratic governors before joining the court: Groban as a senior adviser to Jerry Brown, Evans as chief deputy legal affairs secretary in Gavin Newsom's office8.

In 2022, all four justices on the ballot were retained with 68.0% to 70.9% yes10.

3

Results this close don't look like real elections. They look like a computer algorithm, so the election is fake.

Wrong

Nothing points to an algorithm. Counties hand-check the machine count, and the post had to shave Weber's figure to make the races match. This year's races are unusually close, which party-line voting and a partial count help explain.

Few voters switch parties between elections. Among 2020 presidential voters who also voted for the House in 2022, Pew found just 6% crossed party lines or voted third party. Pew adds that defections and split tickets mattered for individual Senate and governor candidates11.

This year's spread is unusually tight. In 2022, six of seven partisan statewide executive races fell between 58.8% and 60.1% for Democrats, but Republican Lanhee Chen drew 44.7% for controller10. Democrat-vs-Republican races spanned about 3.5 points in 2018 and 6.3 in 201412,13. In Idaho's 2022 statewide races, four Republican wins fell within 2.7 points as two-party shares, but Raul Labrador won attorney general with 62.6%, at least 7 points behind14. These spans are our calculation. This year has no standout like Chen, and the count is partial. Jane Kim led a two-Democrat insurance race 53.1% to 46.9%15.

During the canvass, counties hand-count a random sample of at least 1% of precincts or ballot batches and compare it with the machine count16. Results are due to be certified by Dec. 1117.

The real disagreement

Facts can't settle this part, so we don't rule on it.

Should California tighten deadlines and checks to count faster, at some cost to how easily people can vote by mail?

California mails a ballot to every active voter and counts mailed ballots postmarked by Election Day that arrive within seven days7. That means weeks of counting. As of 5:35 p.m. Nov. 6, about 4 million ballots were still waiting to be processed7.

Count faster and check more

A count that takes weeks invites doubt, even when it's honest.

Speed is part of trust. Three days after the election, about 4 million of roughly 13.7 million ballots, or 29%, were still unprocessed, by our calculation from the state's report7. Thirty-five states require mailed ballots to arrive by Election Day. California waits seven days past it18.

List upkeep has lapsed before. Settling a suit by Judicial Watch in 2019, the state and Los Angeles County agreed to remove up to 1.5 million inactive registrations, and the state agreed to remind counties to drop ineligible names19. At the polls, voters give their name and address and sign, generally with no ID document20. The Heritage Foundation ranks California's election laws 50th of 5121.

Keep access, and count carefully

The slow count is the checking, and speed isn't proof of honesty.

Before a mail ballot counts, officials confirm the voter's registration, verify the signature on the envelope and make sure the person didn't vote anywhere else7. Voters whose signatures are rejected get a chance to fix them22. As of Nov. 6, 76,523 ballots were waiting on such fixes, and about 235,000 mail ballots that arrived after Election Day or came from other counties were still unprocessed7.

Mail is how most Californians vote, with about 13 million mail ballots in 202422. The state "gives voters the greatest options to cast their ballots," in the words of Los Angeles County's registrar22. Before certifying, counties hand-count a random sample of at least 1% of precincts or ballot batches against the machines16. An Election Day receipt deadline would throw out ballots that voters mailed on time.

Where they agree

  • Both sides want every eligible ballot counted once and every ineligible one kept out.
  • Accurate voter rolls help everyone, since a ballot mailed to a stale address serves no one.

What would change minds

  • County results of the 1% manual tally for this election, compared with the machine counts.
  • Counts of mail ballots this year returned undeliverable or rejected, by reason and county.
  • Evidence on whether faster-counting states reject more or fewer ballots from eligible voters than California does.

Sources

Every source was opened and read. Advocacy groups are labeled as such.

Show all 22 sources
  1. 1
    Governor - Statewide Results, 2026 General Election (unofficial)
    California Secretary of StateAs of Nov. 6, 2026, 11:00 p.m.DataBecerra 6,483,228 (65.3%), Hilton 3,451,000 (34.7%).
  2. 2
    Lieutenant Governor - Statewide Results, 2026 General Election (unofficial)
    California Secretary of StateAs of Nov. 6, 2026, 11:00 p.m.DataMa 6,383,951 (65.1%), Romero 3,417,293 (34.9%).
  3. 3
    Controller - Statewide Results, 2026 General Election (unofficial)
    California Secretary of StateAs of Nov. 6, 2026, 11:00 p.m.DataCohen 6,344,496 (65.1%), Morgan 3,398,104 (34.9%).
  4. 4
    Treasurer - Statewide Results, 2026 General Election (unofficial)
    California Secretary of StateAs of Nov. 6, 2026, 11:00 p.m.DataKounalakis 6,360,405 (65.3%), Hawks 3,379,108 (34.7%).
  5. 5
    Attorney General - Statewide Results, 2026 General Election (unofficial)
    California Secretary of StateAs of Nov. 6, 2026, 11:00 p.m.DataBonta 6,370,398 (65.1%), Gates 3,414,343 (34.9%).
  6. 6
    Secretary of State - Statewide Results, 2026 General Election (unofficial)
    California Secretary of StateAs of Nov. 6, 2026, 11:00 p.m.DataWeber 6,470,506 (66.1%), Wagner 3,320,379 (33.9%).
  7. 7
    Unprocessed Ballots Status, November 3, 2026, General Election
    California Secretary of StateAs of Nov. 6, 2026, 5:35 p.m.DataStatewide: 9,661,594 ballots processed and an estimated 3,996,131 remaining, including 235,214 vote-by-mail ballots received after Election Day or forwarded by other counties; 76,523 ballots left to cure.
  8. 8
  9. 9
    State Supreme Court - Statewide Results, 2026 General Election (unofficial)
    California Secretary of StateAs of Nov. 6, 2026, 11:00 p.m.Data
  10. 10
    Statement of Vote, November 8, 2022, General Election: Summary Pages
    California Secretary of State2022-12DataSeven partisan races for state office (governor, lieutenant governor, secretary of state, controller, treasurer, attorney general, insurance commissioner). Retention: Guerrero 70.9%, Liu 69.3%, Jenkins 69.3%, Groban 68.0% yes.
  11. 11
    Republican Gains in 2022 Midterms Driven Mostly by Turnout Advantage
    Pew Research Center2023-07-12ResearchNonpartisan research organization. Based on survey respondents matched to voter files.
  12. 12
    Statement of Vote, November 6, 2018, General Election: Summary Pages
    California Secretary of State2018-12DataDemocrat-vs-Republican races, Democratic share by our calculation from vote counts: governor 61.95%, secretary of state 64.45%, controller 65.45%, treasurer 64.13%, attorney general 63.57%.
  13. 13
    Statement of Vote, November 4, 2014, General Election: Summary Pages
    California Secretary of State2014-12DataDemocrat-vs-Republican races, Democratic share by our calculation from vote counts: governor 59.97%, lieutenant governor 57.16%, secretary of state 53.63%, controller 53.97%, treasurer 58.81%, attorney general 57.49%, insurance commissioner 57.52%.
  14. 14
    Contest Results for November 8, 2022
    Idaho Secretary of State, State of Idaho Elections DatabaseDataRepublican shares of the two-party (R+D) vote, by our calculation from the listed counts: secretary of state McGrane 72.5%, controller Woolf 72.2%, treasurer Ellsworth 71.1%, superintendent Critchfield 69.8%, lieutenant governor Bedke 67.9%, attorney general Labrador 62.6% (367,579 to 219,405). Governor Little: 74.9% of the two-party vote, with independent Ammon Bundy at 17.2% of all votes.
  15. 15
    Insurance Commissioner - Statewide Results, 2026 General Election (unofficial)
    California Secretary of StateAs of Nov. 6, 2026, 11:00 p.m.Data
  16. 16
    1% Manual Tally
    California Secretary of StatePrimary document
  17. 17
    Key Dates and Deadlines, November 3, 2026, General Election
    California Secretary of StatePrimary document
  18. 18
    Table 11: Receipt and Postmark Deadlines for Absentee/Mail Ballots
    National Conference of State LegislaturesUpdated 2026-09-25ResearchBipartisan organization serving state legislatures.
  19. 19
  20. 20
    Voter Verification Without ID Documents
    National Conference of State LegislaturesUpdated 2026-10-14ResearchBipartisan organization serving state legislatures. California: voters state name and address and sign the poll book (Cal. Elec. Code §14216).
  21. 21
    Election Integrity Scorecard: All State Scores
    The Heritage FoundationUpdated 2026-09-08Advocacy / think tankConservative think tank. Ranks states' election laws against its own model legislation. California: 50th, score 26 of 100.
  22. 22

Think we got something wrong? Email editor@viewfromthegallery.com with a source. Corrections are made openly and logged on the page.