Economy · Health care · History · Presidency

Democratic presidents meme: right on FDR, wrong on health care

A Republican president created Medicare's drug benefit. The child poverty drop lasted a year, and Clinton balanced budgets with a Republican Congress.

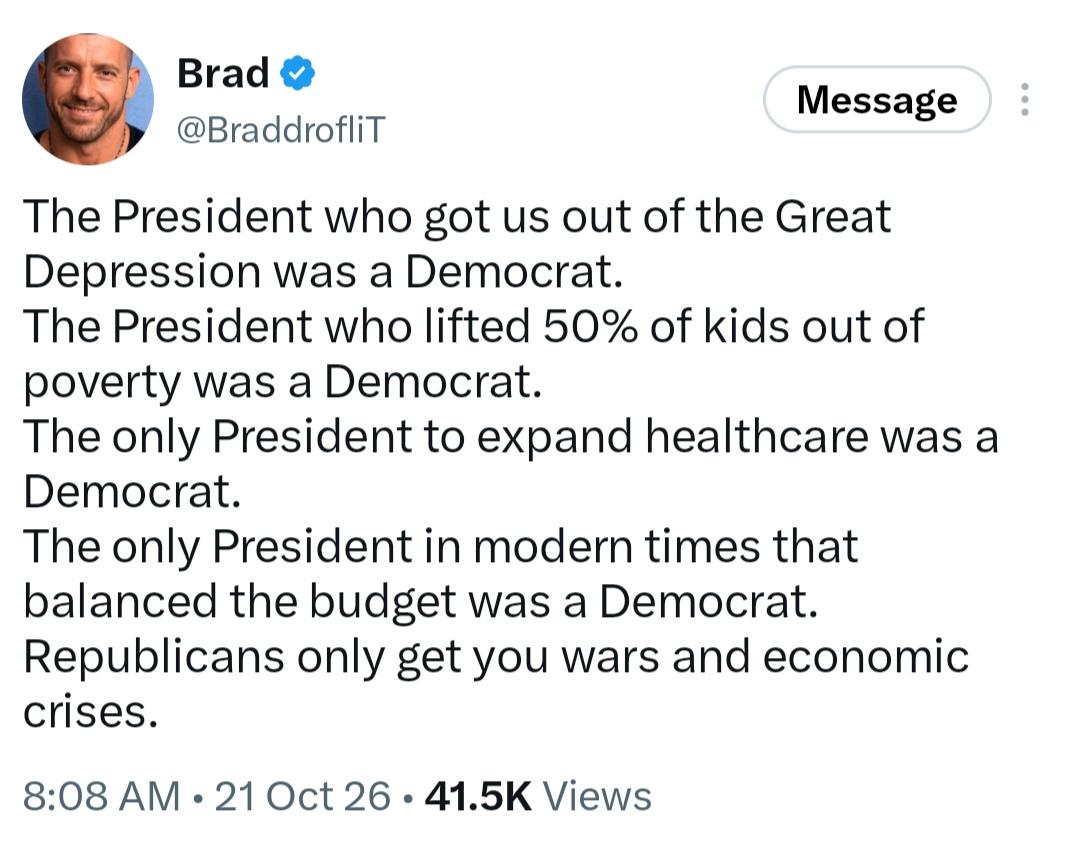
· @BraddrofliT · on XThe post we're checking
The President who got us out of the Great Depression was a Democrat.
The President who lifted 50% of kids out of poverty was a Democrat.
The only President to expand healthcare was a Democrat.
The only President in modern times that balanced the budget was a Democrat.
Republicans only get you wars and economic crises.
Read the post as text
The President who got us out of the Great Depression was a Democrat. The President who lifted 50% of kids out of poverty was a Democrat. The only President to expand healthcare was a Democrat. The only President in modern times that balanced the budget was a Democrat. Republicans only get you wars and economic crises.
Posted Oct 21, 202641.5K views on X as of the screenshot (account has 86K followers), reposted to r/WhitePeopleTwitter on Oct. 23. We couldn't locate the original X post, so this links the Reddit repost.See the original

The bottom line

Franklin Roosevelt was president for the whole climb out of the Depression. Child poverty did fall about half under Biden, for one year. Clinton's surpluses came with a Republican Congress. The health care line is wrong: George W. Bush created Medicare's drug benefit. The real fight is how much a party's past presidents should decide your vote.

The claims

What the post says or clearly implies, checked one by one. How verdicts work

1

The President who got us out of the Great Depression was a Democrat.

Checks out

Franklin Roosevelt, a Democrat, was president from the bottom in March 1933 to full employment in the war. The leading explanation, monetary expansion, began partly with his 1933 devaluation of the dollar. The New Deal's wider role is still argued.

The economy shrank for 43 months, from August 1929 to March 19331, nearly all under Herbert Hoover, a Republican2. The bottom came the month Roosevelt took office3. Real GDP then grew about 9% a year through 1937, by our calculation, and passed its 1929 level in 19364.

Jobs were slower. Official unemployment was 24.9% in 1933 and 14.3% in 1937. A 1937–38 relapse pushed it back to 19.0%, and it was still 14.6% in 1940. It fell to 4.7% in 1942, as the country mobilized for war5. That series counts people in New Deal work-relief jobs as unemployed. Counting them as employed cuts the 1934–41 rates by 4 to 7 points, economist Michael Darby found6.

The Federal Reserve's history of the era dates the Depression from 1929 to 1941, with "return to full output and employment" during the war7. Christina Romer found that nearly all the recovery before 1942 came from a growing money supply, fed mainly by gold flowing in after the 1933 devaluation and from a Europe in political turmoil8.

2

The President who lifted 50% of kids out of poverty was a Democrat.

Missing context

On Census's broader poverty measure, child poverty fell by nearly half in 2021, mostly from pandemic aid Biden signed. It lasted one year. The rate more than doubled in 2022 after the expanded child tax credit lapsed.

On the Supplemental Poverty Measure, which counts tax credits and aid, child poverty fell from 9.6% in 2020 to a record-low 5.1% in 20219. Census reissued its figures this year after a BLS error10, and the trend is "not meaningfully altered"11. The "50%" is the rate: 3.4 million fewer children were poor, among 73 million9.

The drop came from the American Rescue Plan, which passed with no Republican votes12. Census estimated its expanded child tax credit kept 2.9 million children out of poverty in 2021, up from 0.6 million in 2020. Stimulus checks did less than in 2020: 2.3 million children, down from 3.3 million13. Trump-era checks had cut the rate in 2020, from 12.4%9,14.

The tax credit changes were "temporary and limited to calendar year 2021"13. A House-passed extension, with no Republican votes, stalled when Democratic Sen. Joe Manchin opposed it15,16. Child poverty rose to 12.0% in 2022 and was 13.4% in 20259. The official measure, which ignores tax credits, barely moved in 2021: 16.0% to 15.3%17.
Child poverty nearly halved in 2021, then rebounded

0%2%4%6%8%10%12%14%2019202020212022202320242025
Share of children in poverty on Census's corrected Supplemental Poverty Measure, which counts tax credits and aid9. It starts in 2019, the first year of the current method. Pandemic checks cut the 2020 rate. In 2021 more checks and a one-year expanded child tax credit cut it further13.
Show the numbers
Child poverty nearly halved in 2021, then rebounded: the numbers
YearChildren in poverty
201912.4%
20209.6%
20215.1%
202212.0%
202313.5%
202413.5%
202513.4%
3

The only President to expand healthcare was a Democrat.

Wrong

Republican presidents signed several expansions. George W. Bush's 2003 law created Medicare's drug benefit, which now covers about 56 million people. Nixon extended Medicare to people with disabilities and kidney failure. The biggest coverage expansions were Democratic.

Bush signed the law creating Medicare Part D on Dec. 8, 200318. CMS calls it the most significant change to Medicare since 1965, and KFF counts 56 million enrollees in 202619,20. In 1972, Nixon signed what CMS calls "the most significant expansion of Medicare eligibility to date," covering nearly 2 million people under 6519.

Reagan signed the 1986 law that lets workers keep group coverage after leaving a job (COBRA) and requires hospital emergency rooms to screen and stabilize anyone21. Under George H.W. Bush, CMS says, "Medicaid coverage of pregnant women and children was expanded several times"19.

The post's larger point has support. Medicare and Medicaid in 1965 and the Affordable Care Act in 2010 were signed by Democrats22,23, and the uninsured rate fell from 16.0% in 2010 to 8.3% in 202524,25. CBO estimates the Medicaid changes in the 2025 budget law Republicans passed will leave 7.5 million more people uninsured in 203426.

4

The only President in modern times that balanced the budget was a Democrat.

Missing context

Bill Clinton is the only president with a surplus since 1969. A Republican Congress passed all four of those budgets, and a booming economy did nearly half the work. Eisenhower, a Republican, ran three surpluses in the 1950s.

The government ran surpluses in fiscal 1998 through 2001, peaking at $236 billion in 200027. Fiscal 2001 began under Clinton and ended under George W. Bush. The last surplus before that was fiscal 1969, a budget from Lyndon Johnson's term that ended five months into Richard Nixon's. Eisenhower ran surpluses in 1956, 1957 and 1960, and Truman in four years27,28.

Republicans held both chambers of Congress from 199529,30. Three laws helped: a 1990 deficit deal George H.W. Bush signed, a 1993 Clinton law that passed with no Republican votes, and the bipartisan Balanced Budget Act of 199731,32,33. The Congressional Research Service credited policy with "a little more than half" of the swing and the economic boom with the rest34. A meme crediting only the Republican Congress would get the same verdict.

Leave out Social Security and the Postal Service, and the rest of the budget was in surplus in only two of those years, 1999 and 200027. No president has run a surplus since. Fiscal 2026 ended $1.99 trillion in deficit35.

The real disagreement

Facts can't settle this part, so we don't rule on it.

Does a party's record in the White House tell you which party to vote for?

"Republicans only get you wars and economic crises" is a judgment, not a fact we can rule on. The record cuts both ways. By our count from NBER dates, 11 of the 15 recessions since 1929 began under Republican presidents1. The U.S. entered both world wars and Korea, and escalated in Vietnam, under Democrats36,37,38. The Gulf War, Afghanistan, Iraq and this year's war with Iran began under Republicans39,40,41,42. The right's mirror meme, "the party of Lincoln," makes the same move from the other side, crediting today's party with what an earlier coalition did. Its history is real too: 27 Republicans, then the Senate minority, joined 44 Democrats to break the filibuster on the 1964 Civil Rights Act43,30.

Democratic presidents have the better record

The economy has grown faster under Democrats, and the laws that cut poverty and widened coverage were theirs.

From 1949 to 2013, the economy grew 4.33% a year under Democratic presidents and 2.54% under Republicans, economists Alan Blinder and Mark Watson found44. "It has been the president, not Congress, that mattered," they wrote, and the gap can't be explained by the economy each president inherited45. By our count from NBER dates, 11 of the 15 recessions since 1929 began under Republicans, including 1929 and 20071.

The biggest gains were laws Democrats wrote. Social Security and Medicare were Democratic laws. So was the Affordable Care Act46,22,23. Christina Romer found that nearly all the recovery before 1942 came from monetary expansion, fed in part by Roosevelt's 1933 devaluation of the dollar8. When the expanded child tax credit lapsed, child poverty more than doubled in a year9, and a study of 2021 found no significant effect on parents' work47.

Republican presidents have the better record

Republican presidents added drugs to Medicare and backed the fight against inflation. A Republican Congress drove welfare reform and the 1990s surpluses.

Judge parties by the hard problems they solved. Reagan inherited "double-digit inflation and interest rates near 20%"48. Consumer prices rose 13.5% in 1980 and 4.1% in 1988, by our calculation from BLS data49. Republican majorities, first elected in 1994, passed the 1996 welfare overhaul and all four 1990s budgets that ran surpluses50,29,30,27. The Heritage Foundation's Robert Rector called welfare reform "a resounding and unprecedented success"51.

Recession timing flatters Democrats. By our count from NBER dates, the economy peaked within a year of a Republican replacing a Democrat four times: 1953, 1969, 1981 and 20011. Economists Harold Cole and Lee Ohanian estimate that New Deal rules letting industries fix prices and wages explain about 60% of the 1930s shortfall52. And a permanent 2021-style child credit would lead 1.5 million working parents to leave the labor force, Kevin Corinth, Bruce Meyer and colleagues estimate53.

Party scorecards mostly measure luck

Presidents get credit and blame for oil shocks, wars, the Fed and budgets Congress writes.

The growth gap is real. Pinning it on presidents is the problem. Blinder and Watson found that oil shocks, productivity, defense spending and foreign growth explain up to 56% of it. Democrats "would probably like to attribute" much of the gap to better fiscal and monetary policy, they wrote, "but the data do not support such a claim"45. An earlier version said oil, productivity and foreign growth "look a lot more like good luck than good policy"54.

Budgets are different. The Constitution gives Congress the purse55, and the 1990s surpluses needed a Democratic president and a Republican Congress. The Fed is independent within the government56. Paul Volcker, a Carter appointee, led its fight against inflation from 197957. Even Romer traces part of the 1930s recovery to gold fleeing political trouble in Europe8.

Where they agree

  • Recessions and wars began under presidents of both parties1,36,39.
  • The 1990s surpluses took a Democratic president and a Republican Congress27,30.
  • The biggest coverage expansions, Medicare in 1965 and the Affordable Care Act, were Democratic, and Medicare's drug benefit was Republican23,19.

What would change minds

  • An update of Blinder and Watson's study through the Obama, Trump and Biden terms, to see whether the growth gap held up after 2013.
  • A clear policy explanation for the part of the gap that oil, productivity and war don't account for.
  • Better evidence on whether a permanent expanded child tax credit would cut poverty without reducing work53,47.

Sources

Every source was opened and read. Advocacy groups are labeled as such.

Show all 57 sources
  1. 1
    US Business Cycle Expansions and Contractions
    National Bureau of Economic Research2023-03-14DataThe official U.S. recession dates. Recession counts by president are our tally
  2. 2
    Herbert Hoover
    Miller Center, University of VirginiaResearch
  3. 3
    Franklin D. Roosevelt
    Miller Center, University of VirginiaResearch
  4. 4
    Real Gross Domestic Product (GDPCA)
    Federal Reserve Bank of St. Louis (FRED), from BEADataAnnual real GDP in chained 2017 dollars. The 1933–37 growth rate is our calculation
  5. 5
    Historical Statistics of the United States, Colonial Times to 1970, Chapter D (series D 86)
    U.S. Census Bureau1975DataBLS unemployment rates for 1929 onward
  6. 6
    Three-and-a-Half Million U.S. Employees Have Been Mislaid: Or, An Explanation of Unemployment, 1934–1941
    NBER (Michael R. Darby)1975-05ResearchLater published in the Journal of Political Economy (1976)
  7. 7
    The Great Depression
    Federal Reserve History (Gary Richardson)2013-11-22Research
  8. 8
    What Ended the Great Depression?
    Journal of Economic History (Christina D. Romer), author's reprint1992-12Research
  9. 9
  10. 10
    Census Bureau Statement on Supplemental Poverty Measure
    U.S. Census Bureau2026-07-17Primary document
  11. 11
  12. 12
    Roll Call 72: H.R. 1319, American Rescue Plan Act of 2021
    Office of the Clerk, U.S. House of Representatives2021-03-10Primary document
  13. 13
    Poverty in the United States: 2021 (P60-277)
    U.S. Census Bureau2022-09DataUses the figures published before the 2026 correction
  14. 14
    The Supplemental Poverty Measure: 2020 (P60-275)
    U.S. Census Bureau2021-09DataUses the figures published before the 2026 correction
  15. 15
    Roll Call 385: H.R. 5376, Build Back Better Act
    Office of the Clerk, U.S. House of Representatives2021-11-19Primary document
  16. 16
  17. 17
    Expansions to Child Tax Credit Contributed to 46% Decline in Child Poverty Since 2020
    U.S. Census Bureau2022-09-13DataUses the figures published before the 2026 correction
  18. 18
  19. 19
    Presidents and CMS Milestones
    Centers for Medicare & Medicaid ServicesPrimary document
  20. 20
    Medicare Part D Enrollment, Premiums, and Cost Sharing in 2026
    KFF2026-06-11ResearchNonpartisan health policy research group
  21. 21
    Public Law 99-272, Consolidated Omnibus Budget Reconciliation Act of 1985
    U.S. Government Publishing Office1986-04-07Primary document
  22. 22
    History
    Centers for Medicare & Medicaid ServicesPrimary document
  23. 23
    Medicare & Medicaid Milestones, 1937–2015
    Centers for Medicare & Medicaid Services2015-07Primary document
  24. 24
  25. 25
  26. 26
    Public Law 119-21, Title VII, Subtitle B, Chapter 1, Medicaid (cost estimate)
    Congressional Budget Office, via the Internet Archive2025DataArchived copy. cbo.gov refuses automated requests
  27. 27
    Historical Tables, Table 1.1: Summary of Receipts, Outlays, and Surpluses or Deficits
    Office of Management and Budget, via GovInfo2026-04-03Data
  28. 28
    Historical Tables, Introduction
    Office of Management and Budget, via GovInfo2026-04-03DataExplains fiscal-year dates: July–June before 1977
  29. 29
    Party Divisions of the House of Representatives, 1789 to Present
    U.S. House of Representatives, History, Art & ArchivesData
  30. 30
    Party Division
    U.S. SenateData
  31. 31
    Roll Call 528: H.R. 5835, Omnibus Budget Reconciliation Act of 1990
    Office of the Clerk, U.S. House of Representatives1990-10-26Primary document
  32. 32
    Roll Call 406: H.R. 2264, Omnibus Budget Reconciliation Act of 1993
    Office of the Clerk, U.S. House of Representatives1993-08-05Primary document
  33. 33
    Roll Call 345: H.R. 2015, Balanced Budget Act of 1997
    Office of the Clerk, U.S. House of Representatives1997-07-30Primary document
  34. 34
    The Economics of the Federal Budget Surplus (RL30583)
    Congressional Research Service, via EveryCRSReport.com2001-03-30ResearchNonpartisan research arm of Congress. Third-party mirror of the report
  35. 35
    Final Monthly Treasury Statement, Fiscal Year 2026
    U.S. Department of the Treasury2026-10Data
  36. 36
    Official Declarations of War by Congress
    U.S. SenatePrimary document
  37. 37
    Statement by the President on the Situation in Korea
    Harry S. Truman Presidential Library1950-06-27Primary document
  38. 38
    Foreign Relations of the United States, 1964–1968, Volume III, Document 97 (editorial note)
    U.S. Department of State, Office of the Historian1965-07-28Primary document
  39. 39
    The Gulf War, 1991
    U.S. Department of State, Office of the HistorianResearch
  40. 40
    Presidential Address to the Nation
    The White House (George W. Bush archive)2001-10-07Primary document
  41. 41
    President Bush Addresses the Nation
    The White House (George W. Bush archive)2003-03-19Primary document
  42. 42
    U.S. Forces Launch Operation Epic Fury
    Seapower (Navy League), reprinting a U.S. Central Command release2026-02-28Primary document
  43. 43
  44. 44
    Why does the economy do better with Democrats in the White House?
    American Economic Association (Tim Hyde)2016-06-20ResearchSummary of Blinder and Watson, American Economic Review (2016)
  45. 45
    Presidents and the U.S. Economy: An Econometric Exploration (July 2015 revision)
    Alan S. Blinder and Mark W. Watson, copy hosted by FactCheck.org2015-07ResearchRevised draft of the paper published in the American Economic Review in 2016
  46. 46
    Social Security Act (1935)
    National ArchivesPrimary document
  47. 47
  48. 48
    The Reagan Presidency
    Ronald Reagan Presidential LibraryResearchRun by the National Archives
  49. 49
    Consumer Price Index for All Urban Consumers: All Items in U.S. City Average, not seasonally adjusted (CPIAUCNS)
    Federal Reserve Bank of St. Louis (FRED), from BLSDataAnnual inflation rates are our calculation from annual averages
  50. 50
  51. 51
    Hearing to Review Outcomes of 1996 Welfare Reforms (testimony of Robert Rector)
    U.S. House Committee on Ways and Means, via GovInfo2006-07-19Advocacy / think tankRector is a researcher at the Heritage Foundation, a conservative think tank
  52. 52
    New Deal Policies and the Persistence of the Great Depression: A General Equilibrium Analysis
    Journal of Political Economy (Harold L. Cole and Lee E. Ohanian), copy on Ohanian's site2004-08Research
  53. 53
    The Anti-Poverty, Targeting, and Labor Supply Effects of Replacing a Child Tax Credit with a Child Allowance
    NBER (Corinth, Meyer, Stadnicki and Wu)2021-10ResearchA simulation of a permanent policy, not a measurement of 2021
  54. 54
    Presidents and the U.S. Economy: An Econometric Exploration (Working Paper 20324)
    NBER (Alan S. Blinder and Mark W. Watson)2014-07Research
  55. 55
  56. 56
    What does it mean that the Federal Reserve is "independent within the government"?
    Board of Governors of the Federal Reserve SystemPrimary document
  57. 57
    Paul A. Volcker
    Federal Reserve HistoryResearch

Think we got something wrong? Email editor@viewfromthegallery.com with a source. Corrections are made openly and logged on the page.