Federal budget · Social Security · Medicare · Taxes

The debt and interest figures check out. The 2032 date needs context

Greene's debt and interest numbers are right. 2032 is when Social Security's retirement fund runs short. Medicare's hospital fund lasts into 2033.

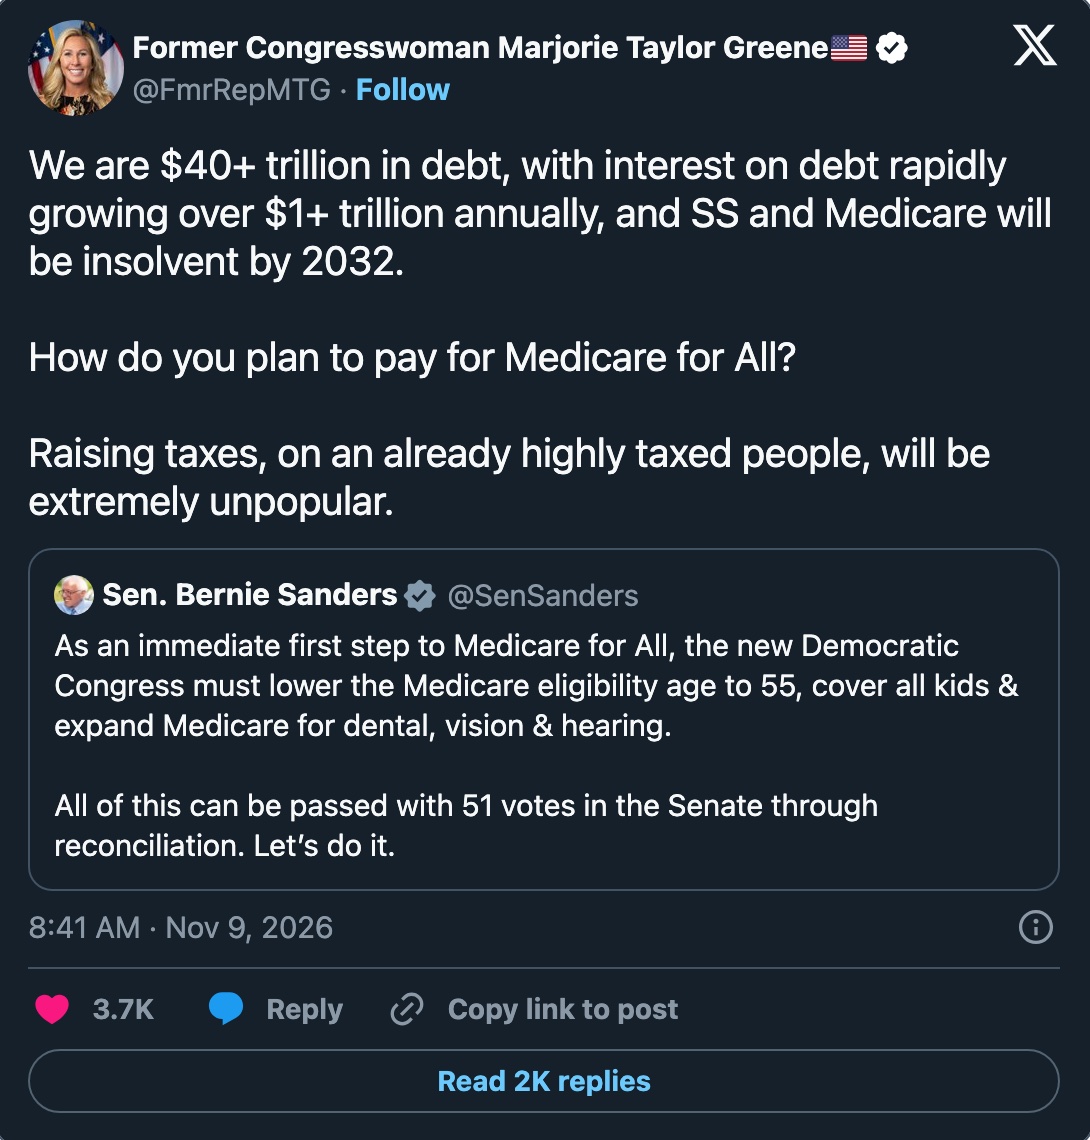
· @FmrRepMTG · on XThe post we're checking
We are $40+ trillion in debt, with interest on debt rapidly growing over $1+ trillion annually, and SS and Medicare will be insolvent by 2032.

How do you plan to pay for Medicare for All?

Raising taxes, on an already highly taxed people, will be extremely unpopular.
Screenshot of the post on X. Shown for commentary.
Read the post as text
We are $40+ trillion in debt, with interest on debt rapidly growing over $1+ trillion annually, and SS and Medicare will be insolvent by 2032. How do you plan to pay for Medicare for All? Raising taxes, on an already highly taxed people, will be extremely unpopular.

The bottom line

The debt tops $40 trillion and net interest $1 trillion, as Greene says. But 2032 is Social Security's retirement fund, which could still pay 78%. Medicare's hospital fund lasts into 2033. U.S. taxes are low by OECD standards. The fight is over whether new revenue should pay for new coverage or for promises already made.

The claims

What the post says or clearly implies, checked one by one. How verdicts work

1

We are $40+ trillion in debt.

Checks out

Treasury's total debt passed $40 trillion on Aug. 18 and stood at $40.55 trillion on Nov. 6. About $7.8 trillion of it is owed to federal trust funds and other government accounts.

Treasury reports the total every business day. It first topped $40 trillion on Aug. 18, 2026, and hasn't dipped below since. On Nov. 6 it was $40,552,751,019,092.611.

Of that total, $32.76 trillion is debt held by the public, what Washington owes outside lenders and the measure CBO uses most1,2. The other $7.79 trillion is owed to federal accounts such as the Social Security trust funds1,2.

Even the smaller measure reached 100% of GDP in fiscal 2026, CBO says, the highest since 19463.

2

Interest on the debt is rapidly growing, at over $1 trillion a year.

Checks out

Net interest was $1.05 trillion in fiscal 2026, about triple the 2020 level, and CBO projects more growth. The pace has slowed, to 8% in fiscal 2026 from more than 30% in 2023 and 2024.

Treasury's year-end statement puts net interest at $1,051.75 billion for the year that ended Sept. 30, up from $970.36 billion in 20254. CBO's historical data, which has 2025 at $969.9 billion, puts 2020 at $345 billion5. As a share of the economy, net interest went from 1.6% to about 3.3%, the highest since at least 1962, by our calculation for 20265,4,6.

CBO's monthly review tracks net interest on the public debt, gross interest minus what trust funds receive. That came to $1.14 trillion, up 11%3. Gross interest was $1.36 trillion, but $218 billion of it went to federal trust funds4.

Growth has cooled. Net interest rose 38% in 2023, 34% in 2024, 10% in 2025 and 8% in 2026, by our calculation5,4. That 8% still outpaced the economy, which grew about 6% before inflation in fiscal 20266. CBO's February baseline projects $1.11 trillion for 2027, rising to $2.14 trillion by 20367.
Net interest tripled from 2020 to 2026. Its share of GDP doubled.

02505007501K1.25K196219661970197419781982198619901994199820022006201020142018202220262020: 345.472026: 1,052

Not adjusted for inflation. 2026 is from the Monthly Treasury Statement. For 2025, CBO's figure is $969.9 billion and Treasury's is $970.36 billion.

Federal net interest by fiscal year, from CBO's historical data through 20255 and Treasury's year-end statement for 20264. The 2026 share of GDP is our calculation using BEA's GDP6. Gross interest, which includes payments to federal trust funds, runs higher.
Show the numbers
Net interest tripled from 2020 to 2026. Its share of GDP doubled.: the numbers
YearBillions of dollarsPercent of GDP (%)
19626.891.18
19637.741.25
19648.21.24
19658.591.21
19669.391.2
196710.271.23
196811.091.24
196912.71.3
197014.381.37
197114.841.33
197215.481.27
197317.351.28
197421.451.45
197523.241.45
197626.731.5
197729.91.48
197835.461.56
197942.631.66
198052.531.88
198168.772.2
198285.032.57
198389.812.54
1984111.12.81
1985129.483.04
1986136.023.01
1987138.612.91
1988151.82.95
1989168.983.04
1990184.353.13
1991194.453.19
1992199.343.11
1993198.712.93
1994202.932.83
1995232.133.07
1996241.053.03
1997243.982.89
1998241.122.7
1999229.762.42
2000222.952.2
2001206.171.96
2002170.951.58
2003153.071.36
2004160.251.33
2005183.991.43
2006226.61.66
2007237.111.66
2008252.761.71
2009186.91.29
2010196.191.32
2011229.961.49
2012220.411.37
2013220.891.32
2014228.961.31
2015223.181.23
2016240.031.29
2017262.551.36
2018324.981.59
2019375.161.76
2020345.471.62
2021352.341.53
2022475.891.86
2023658.272.4
2024879.883.04
2025969.943.2
20261,0523.26
3

SS and Medicare will be insolvent by 2032.

Missing context

Social Security's retirement fund, which pays retirement and survivor benefits, runs short in late 2032 and could then pay 78%. Medicare's hospital fund lasts into 2033, and its other fund can't run dry.

The Trustees project the retirement fund can pay full benefits until late 20328. CBO has it running out in fiscal 2032 too9. The disability fund lasts through at least 2100, the projection's end. Merged, which would take a change in law, the two funds could pay in full until the third quarter of 20348.

Medicare's hospital fund runs short in the second quarter of 203310. Parts B and D can't be depleted, because their financing is reset each year. General revenue paid about 75% of their costs in 202510. This year's report projects general revenue will top 45% of Medicare's costs in fiscal 2026, the tenth straight such finding. Two such findings in a row trigger a formal funding warning8.

CRS defines insolvency as trust funds "unable to pay benefits in full and on time," which "does not mean that Social Security will be completely broke"11. Incoming taxes would cover 78% of retirement benefits and 89% of hospital costs at depletion8. Congress has never let the hospital fund run out10.

4

Americans are already a highly taxed people.

Missing context

By the standard international measure, Americans pay less tax than people in most OECD countries, and federal revenue is near its 50-year average. Health premiums the OECD counts as compulsory, which other countries often collect as tax, narrow the gap.

The OECD compares federal, state and local taxes as a share of each economy. The U.S. figure for 2024 was 25.6%, 31st of 38 members, against an average of 34.1%12. Canada was at 34.9% and Germany at 38.0%13. Federal revenue alone was 16.8% of GDP in fiscal 2026, just under the 50-year average of 17.3%3.

Some of what other countries collect as tax, Americans pay as health premiums. In 2023 the OECD counted 28% of U.S. health spending as government programs and another 55% as compulsory insurance, including private plans it treats as compulsory under the ACA14. Its tax figures leave out payments to private funds, even compulsory ones15. Federal taxes fall hardest at the top, where the top 1% paid 26% of them in 2023, on 16% of income before transfers and taxes16.

In March, 59% of Americans told Gallup their federal income taxes are too high17. KFF finds 66% favor Medicare-for-all, but support drops to about a third when people hear it could raise taxes18.

The real disagreement

Facts can't settle this part, so we don't rule on it.

With debt and interest climbing, should Congress expand public health coverage now and pay for it with new taxes, or shore up the programs it already runs first?

Sanders asked for a first step, lowering the Medicare age to 55 and adding coverage for kids and for dental, vision and hearing19. Greene asked about Medicare for All, the goal he names. In 2022, CBO estimated that lowering the age to 60 alone would add $155 billion to deficits over 2026–203120. A 2020 budget-watchdog analysis estimated the full plan would likely add $25 trillion to $35 trillion to federal costs over 10 years21.

Expand coverage now, paid for with taxes

Americans already pay for health care, privately and at high prices. Swapping premiums for open taxes, starting with high earners, mostly changes who writes the check.

U.S. health spending averaged $14,775 per person in 2024, nearly double the $7,860 average in peer countries22. Family coverage through an employer now costs $28,303 a year, and workers pay $7,471 of it directly23. A tax-funded plan would take the place of some of those premiums. In CBO's five single-payer designs, national health spending in 2030 ranged from $0.7 trillion lower to $0.3 trillion higher, and out-of-pocket costs fell24.

CBO and JCT estimated that extending the 3.8% investment-income tax to active business owners would raise $420 billion over 10 years25, and two more points on the top four brackets $569.5 billion26. Both are 2024 estimates, made before the 2025 tax law. Asked in 2025 how to reduce the debt, 63% of Americans backed higher income-tax rates on upper earners27. With U.S. taxes well below the OECD average, there is room12.

Shore up current programs first

Washington can't yet pay for the promises it has already made. New revenue should close those gaps before Congress adds a costly new one.

The deficit hit $2.0 trillion in fiscal 2026, and debt held by the public reached 100% of GDP, the highest since 19463. CBO projects a $3.1 trillion deficit by 2036, driven largely by rising interest7. Interest already costs more than defense and will pass Medicare by 2028, the center-right American Action Forum calculates28. Social Security's retirement fund faces a 22% benefit cut in 2032 unless Congress acts8.

Sanders calls his plan a first step to Medicare for All. In 2020, CRFB estimated that financing $30 trillion would take the equivalent of a 32% payroll tax or doubling all income tax rates, and that taxes on high earners and corporations "alone could not finance" it21. Medicare's costs rise from 4.1% of GDP in 2026 to 6.5% in 2050, and the Trustees have issued a Medicare funding warning nine years running8.

Where they agree

  • Both sides work from the Trustees' dates: without new money or benefit changes, Social Security's retirement fund runs short in 2032 and Medicare's hospital fund in 20338.
  • Both start from the fact that U.S. health spending per person is nearly double the peer-country average22.

What would change minds

  • A CBO score of lowering the age to 55, paired with specific taxes, would show whether a first step can be paid for without adding to deficits.
  • If employers' premium savings showed up in paychecks, new taxes would replace costs workers already carry. Evidence on that pass-through would move both sides.
  • Closing Social Security's and Medicare's gaps has a price tag, and knowing it would show how much revenue is left for anything new.

Sources

Every source was opened and read. Advocacy groups are labeled as such.

Show all 28 sources
  1. 1
    Debt to the Penny (daily total public debt outstanding, debt held by the public, intragovernmental holdings)
    U.S. Department of the Treasury, Fiscal Data2026-11-06DataFigures for Aug. 17–18 and Nov. 6, 2026, read from the dataset's API
  2. 2
    Federal Debt: A Primer
    Congressional Budget Office2020-03Research
  3. 3
    Monthly Budget Review: Summary for Fiscal Year 2026
    Congressional Budget Office2026-11-09Data
  4. 4
    Monthly Treasury Statement, September 2026 (Table 5, interest; Table 9, net interest)
    U.S. Department of the Treasury, Fiscal Data2026-09-30DataFiscal year 2026 totals, read from the dataset's API
  5. 5
    Historical Budget Data, February 2026 (Tables 3 and 3a, net interest)
    Congressional Budget Office2026-02DataSpreadsheet supplementing The Budget and Economic Outlook: 2026 to 2036
  6. 6
    Gross Domestic Product (GDP), quarterly, seasonally adjusted annual rate
    Bureau of Economic Analysis, via FRED (Federal Reserve Bank of St. Louis)Data
  7. 7
    The Budget and Economic Outlook: 2026 to 2036
    Congressional Budget Office2026-02-11DataNet interest projections from Table 1-1 of the accompanying budget projections spreadsheet
  8. 8
    A Summary of the 2026 Annual Reports
    Social Security and Medicare Boards of Trustees2026Primary document
  9. 9
    CBO's 2026 Long-Term Projections for Social Security
    Congressional Budget Office2026-09-17Data
  10. 10
  11. 11
    Social Security: What Would Happen If the Trust Funds Ran Out? (RL33514)
    Congressional Research Service, via EveryCRSReport.com2022-09-28ResearchCongress's nonpartisan research service. Its projections are older; cited for how depletion works
  12. 12
    Revenue Statistics 2025: United States (country note)
    OECD2025-12-09Data2024 figures are provisional. The figures are in the note's PDF, linked from this page
  13. 13
  14. 14
  15. 15
    Revenue Statistics 2025: The OECD classification of taxes and interpretative guide
    OECD2025-12-09Primary documentSays contributions "paid to private funds are not treated as taxes"
  16. 16
    The Distribution of Household Income, 2023
    Congressional Budget Office2026-09Data
  17. 17
    Americans' Tax Views Remain Negative
    Gallup2026-04-10DataPoll fielded March 2–18, 2026
  18. 18
    Current and Historical Public Opinion on Medicare-for-All and Other National Health Plan Proposals
    KFF2026-10-06ResearchNonpartisan health-policy research and polling group. Cites a September 2026 KFF poll
  19. 19
    Reconciliation could pass Sanders' Medicare plan. Trump could veto it
    View from the Gallery2026-11-09JournalismOur breakdown of the Sanders post Greene quoted
  20. 20
  21. 21
    Choices for Financing Medicare for All
    Committee for a Responsible Federal Budget2020-03-17Advocacy / think tankNonpartisan budget watchdog that favors deficit reduction
  22. 22
    How does health spending in the U.S. compare to other countries?
    Peterson-KFF Health System Tracker2026-03-11ResearchHealth-policy research partnership of KFF and the Peterson Center on Healthcare, using OECD data
  23. 23
    Workers Now Pay $7,471 on Average Annually for Family Health Coverage (2026 Employer Health Benefits Survey)
    KFF2026-10-22ResearchNonpartisan health-policy research and polling group
  24. 24
  25. 25
    Expand the Base of the Net Investment Income Tax to Include the Income of Active Participants in S Corporations and Limited Partnerships
    Congressional Budget Office, Options for Reducing the Deficit: 2025 to 20342024-12-12DataEstimate by the staff of the Joint Committee on Taxation
  26. 26
    Increase Individual Income Tax Rates on Ordinary Income
    Congressional Budget Office, Options for Reducing the Deficit: 2025 to 20342024-12-12DataEstimated before the 2025 tax law extended the 2017 rate cuts, so a new score would differ
  27. 27
    Americans Favor Spending Cuts Over More Taxes to Cut Deficit
    Gallup2025-10-14DataPoll fielded Sept. 2–16, 2025
  28. 28
    Interest Payments on the National Debt: the Near- and Long-term Outlook
    American Action Forum2026-03-24Advocacy / think tankCenter-right policy group, working from CBO's baseline

Think we got something wrong? Email editor@viewfromthegallery.com with a source. Corrections are made openly and logged on the page.