Health care · Medicare · Economy

U.S. health spending is about twice that of six peer countries

The U.S. does spend about twice as much per person. Whether Medicare for All would capture that gap is what the estimates disagree on.

· @SenSanders · on XThe post we're checking
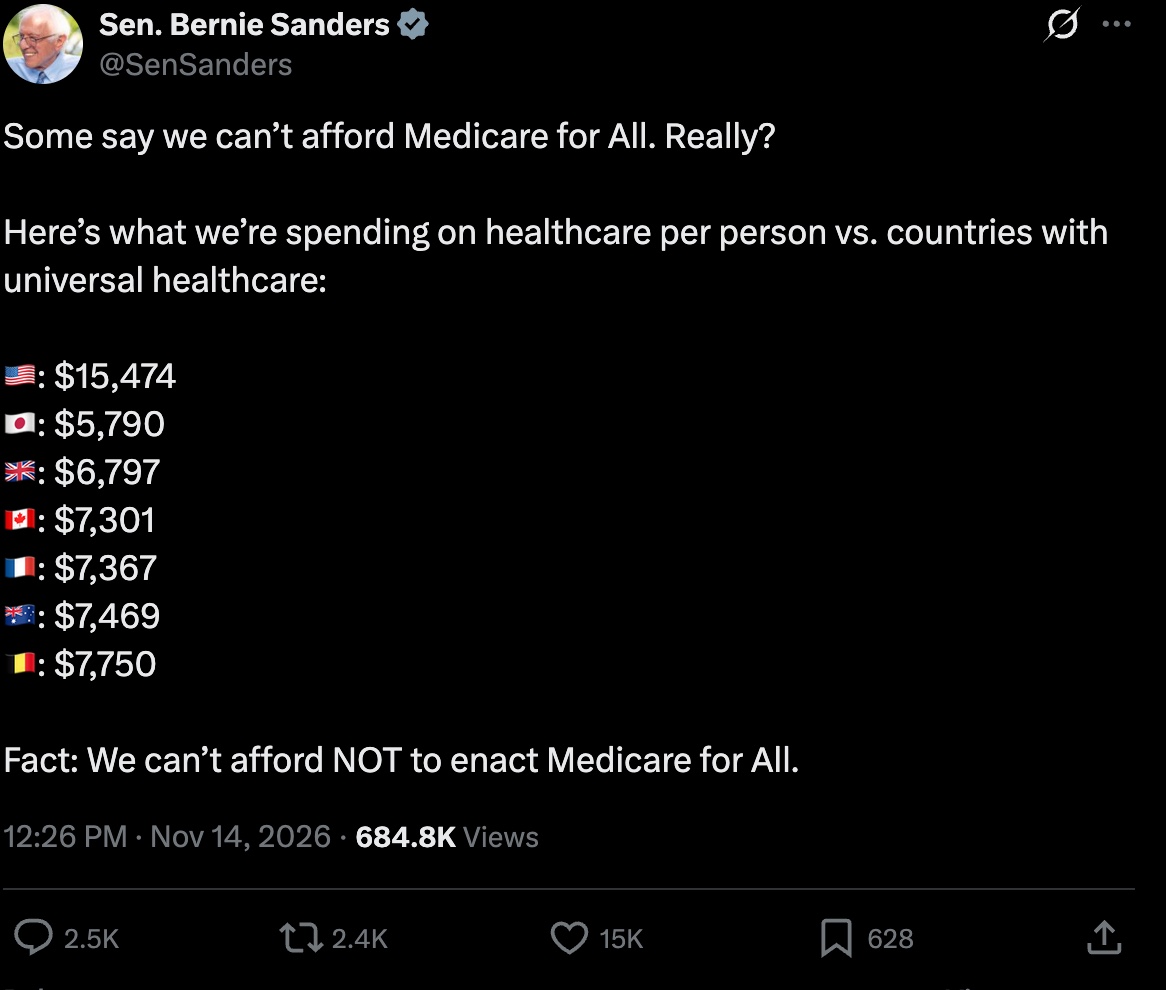
Some say we can’t afford Medicare for All. Really?

Here’s what we’re spending on healthcare per person vs. countries with universal healthcare:

🇺🇸: $15,474
🇯🇵: $5,790
🇬🇧: $6,797
🇨🇦: $7,301
🇫🇷: $7,367
🇦🇺: $7,469
🇧🇪: $7,750

Fact: We can’t afford NOT to enact Medicare for All.
Screenshot of the post on X. Shown for commentary.
Read the post as text
Some say we can’t afford Medicare for All. Really? Here’s what we’re spending on healthcare per person vs. countries with universal healthcare: 🇺🇸: $15,474 🇯🇵: $5,790 🇬🇧: $6,797 🇨🇦: $7,301 🇫🇷: $7,367 🇦🇺: $7,469 🇧🇪: $7,750 Fact: We can’t afford NOT to enact Medicare for All.
Posted Nov 14, 2026About 685,000 views on X as of Nov. 15. Sanders' account has about 11.6 million followers.See the original

The bottom line

The U.S. figure is CMS's 2024 count. Five of six foreign figures match OECD's 2025 edition exactly, and Britain's was $50 high. CMS's total includes research and construction that OECD leaves out1,2. OECD's own U.S. estimate, $14,885, is still about twice these countries' average3. Whether Medicare for All would capture that gap is disputed.

The claims

What the post says or clearly implies, checked one by one. How verdicts work

1

The U.S. spends $15,474 per person on health care.

Checks out

That's CMS's official figure for 2024: $5.3 trillion in national health spending, divided by the population. It's the standard U.S. measure, but it's broader than the one used for international comparisons.

CMS says national health spending grew 7.2% to $5.3 trillion in 2024, "or $15,474 per person," 18.0% of GDP4. Private insurance paid 31% of it, Medicare 21% and Medicaid 18%4.

That total includes $238.7 billion of investment: noncommercial medical research, plus structures and equipment, the value of new buildings and capital equipment put in place by medical establishments1,5. That's about $700 a person, by our division. Spending on care itself, which CMS calls health consumption, came to about $14,775 a person1,2.

2

Japan, the U.K., Canada, France, Australia and Belgium spend $5,790 to $7,750 per person, far less than the U.S.

Missing context

The post's figures match OECD's 2025 edition, except Britain's, which was $50 high. But OECD counts only current spending, and its own U.S. estimate was $14,885, still about twice these countries' average.

OECD's Health at a Glance 2025 lists Japan at $5,790, Canada $7,301, France $7,367, Australia $7,469 and Belgium $7,750 for 2024, adjusted for purchasing power. It lists Britain at $6,747, not $6,7973. Figures for Japan, Australia, Belgium and the U.S. are OECD estimates3,6.

OECD measures "final consumption" of health care, leaving out CMS's investment spending7,2. Its U.S. figure, $14,885 in the 2025 edition, is OECD's own estimate, close to CMS's $14,775 for consumption3,1. By our math, the six countries averaged $7,071. The U.S. is 2.1 times that on OECD's estimate, 2.09 on CMS consumption and 2.2 with the post's figures.

OECD has since revised 2024. Its database now puts the U.S. at $14,823 and the six at $5,968 to $8,096. Britain is now $7,008, so on revised data the post's U.K. figure is $211 too low. The U.S. comes to about 2.0 times the six-country average, by our calculation8. Peterson-KFF finds a similar gap against 11 rich countries2.
Since 2000, U.S. spending has run about twice the six countries'

$0$5000$10000$1500020002002200420062008201020122014201620182020202220242024: $14823.14

OECD current health expenditure per person, current PPPs. Excludes investment, unlike CMS's $15,474.

Current health spending per person in U.S. dollars, adjusted for purchasing power, from OECD's revised database as of Nov. 15, 2026, so 2024 differs slightly from OECD's 2025 edition8. The peer line is our simple average of the post's six countries. Some series have breaks or estimates.
Show the numbers
Since 2000, U.S. spending has run about twice the six countries': the numbers
YearUnited StatesSix-country average
2000$4534.73$2224.10
2001$4886.51$2375.60
2002$5316.23$2578.50
2003$5727.07$2689.00
2004$6069.67$2876.30
2005$6431.89$2960.60
2006$6806.11$3104.60
2007$7163.76$3265.40
2008$7381.52$3416.50
2009$7641.85$3549.90
2010$7875.82$3713.80
2011$8073.47$3905.00
2012$8338.51$4052.50
2013$8512.13$4248.70
2014$8928.28$4398.60
2015$9360.44$4534.50
2016$9727.22$4712.60
2017$10045.44$4816.60
2018$10486.07$4961.10
2019$10922.22$5191.40
2020$12076.79$5696.60
2021$12523.74$6271.20
2022$13061.95$6647.30
2023$13932.60$7044.40
2024$14823.14$7293.70
3

Implied: since these countries spend far less, the U.S. can afford Medicare for All.

Missing context

The gap shows room to save, not that Sanders' plan would capture it. CBO's 2020 illustrative options for 2030 run from national savings to an increase, and all five add trillions in federal spending.

Anderson and colleagues trace most of the gap to higher U.S. prices, not more care9. In 2020 CBO modeled five illustrative single-payer options, not Sanders' bill. Against current law, 2030 national spending would range from $0.7 trillion lower to $0.3 trillion higher, with Medicare-style payment rates and administrative savings driving the decreases10. Sponsors cite a CBO estimate of $650 billion a year in savings11. We did not find that figure in the CBO summary we read.

Federal spending would rise $1.5 trillion to $3.0 trillion in 2030 in all five options10. Mercatus, a free-market research center, in 2018 put Sanders' then-current bill at $32.6 trillion in new federal commitments over 2022–2031, assuming provider payments more than 40% below private rates12. A Yale team in The Lancet estimated 13% national savings compared with the status quo13.

The six countries don't run Sanders' model, either. Each pays $882 to $2,176 a person through voluntary insurance or out of pocket, by OECD's split3. Sanders' bill would have no premiums, copays or deductibles11.

The real disagreement

Facts can't settle this part, so we don't rule on it.

Should the U.S. put everyone in one public plan, betting that lower prices and less paperwork pay for it, or attack prices within a mixed system that keeps private coverage?

Americans pay far more per person than people in other rich countries2. The split is over whether one public payer is the fix, or a costly gamble.

One public plan for everyone

Other rich countries spend about half as much per person and cover everyone. A single public payer can bargain prices down and end the paperwork.

Peer countries spend about half as much per person2. Among 10 rich countries, the U.S. ranks last overall in the Commonwealth Fund's 2024 comparison, with life expectancy more than four years below the average14. The other nine "all have found a way" to cover everyone14. Here, 26.7 million people went uninsured all year in 202515.

The gap is mostly prices, Anderson and colleagues found9. Supporters argue one payer can set prices for everyone and, sponsors say, end insurance paperwork11. A Yale team in The Lancet estimated single-payer would save 13% of national spending compared with the status quo, more than $450 billion a year in 2017 dollars, and that access for all would save more than 68,000 lives a year13. In CBO's 2020 options, Medicare-style rates and administrative savings cut national spending by up to $0.7 trillion in 203010.

Cut costs without single-payer

Medicare for All moves trillions onto the federal budget and cuts provider payments. Go after prices and coverage gaps without ending private insurance.

Sanders' plan would make Washington pay for nearly all health care. Mercatus estimated in 2018 that Sanders' then-current bill would add $32.6 trillion in federal commitments over 2022–2031, more than even doubling federal income taxes would raise, even with provider payments more than 40% below private rates12. In all five of CBO's 2020 illustrative options, federal spending would rise $1.5 trillion to $3.0 trillion in 203010.

For the designs it analyzed, CBO found demand for care would outrun supply, bringing "delays and forgone care," especially with lower payment rates10. In Canada, physicians reported a median 28.6-week wait from GP referral to treatment in 2025, in the Fraser Institute's survey16. Targeted price policy can lower prices without a single payer. Had Medicare's first negotiated prices applied a year earlier, they would have saved an estimated $6 billion, about 22%, on 10 drugs, CMS says17.

Where they agree

  • Both sides can work from Anderson and colleagues' finding that higher prices, not more care, drive most of the U.S. spending gap9.
  • Both can point to CBO's 2020 illustrative options, not a score of Sanders' bill, in which coverage would become nearly universal and federal spending would rise $1.5 trillion to $3.0 trillion in 203010.

What would change minds

  • A CBO score of the current Medicare for All bill, with its actual payment rates, showing national and federal spending side by side.
  • Evidence on how U.S. hospitals and doctors respond when payments fall toward Medicare rates: fewer services, longer waits, or lower costs.

Sources

Every source was opened and read. Advocacy groups are labeled as such.

Show all 17 sources
  1. 1
    National Health Expenditure Data: Historical (Tables 1 and 2, NHE by type of expenditure, 1960-2024)
    Centers for Medicare & Medicaid Services2024 dataDataTables are in the NHE tables zip file on this page
  2. 2
    How does health spending in the U.S. compare to other countries?
    Peterson-KFF Health System Tracker2026-03-11ResearchPeterson Center on Healthcare and KFF, a nonpartisan health-policy research group
  3. 3
    Health at a Glance 2025, Figure 7.4: Health expenditure per capita, 2024 (or nearest year), data file
    OECD2025-11-13DataExcel download of the figure's data, from OECD Health Statistics 2025
  4. 4
    National Health Expenditure Fact Sheet
    Centers for Medicare & Medicaid Services2024 dataData
  5. 5
    National Health Expenditure Accounts: Methodology Paper, 2024 (definitions, sources and methods)
    Centers for Medicare & Medicaid Services2024 dataPrimary document
  6. 6
  7. 7
  8. 8
  9. 9
    It's Still The Prices, Stupid: Why The US Spends So Much On Health Care, And A Tribute To Uwe Reinhardt
    Health Affairs2019-01-07ResearchGerard F. Anderson, Peter Hussey and Varduhi Petrosyan
  10. 10
  11. 11
    Jayapal, Sanders, Dingell, hundreds of health care workers introduce Medicare for All
    Office of Rep. Pramila Jayapal2025-04-29Advocacy / think tankPress release from the bill's sponsors
  12. 12
    The Costs of a National Single-Payer Healthcare System
    Mercatus Center at George Mason University2018-07-30Advocacy / think tankFree-market research center. Charles Blahous, scoring the Sanders single-payer bill then before the Senate (working paper, July 30, 2018)
  13. 13
    Improving the prognosis of health care in the USA
    The Lancet2020-02ResearchAlison P. Galvani and colleagues, Yale
  14. 14
    Mirror, Mirror 2024: A Portrait of the Failing U.S. Health System
    The Commonwealth Fund2024-09Advocacy / think tankHealth-policy foundation that supports expanding coverage
  15. 15
  16. 16
    Waiting Your Turn: Wait Times for Health Care in Canada, 2025 Report
    Fraser Institute2025-12-09Advocacy / think tankCanadian free-market think tank. Survey of physicians
  17. 17
    Negotiating for Lower Drug Prices Works, Saves Billions
    Centers for Medicare & Medicaid Services2024-08-15Primary documentSavings are CMS's estimate had the prices applied in 2023. Prices take effect in 2026

Think we got something wrong? Email editor@viewfromthegallery.com with a source. Corrections are made openly and logged on the page.