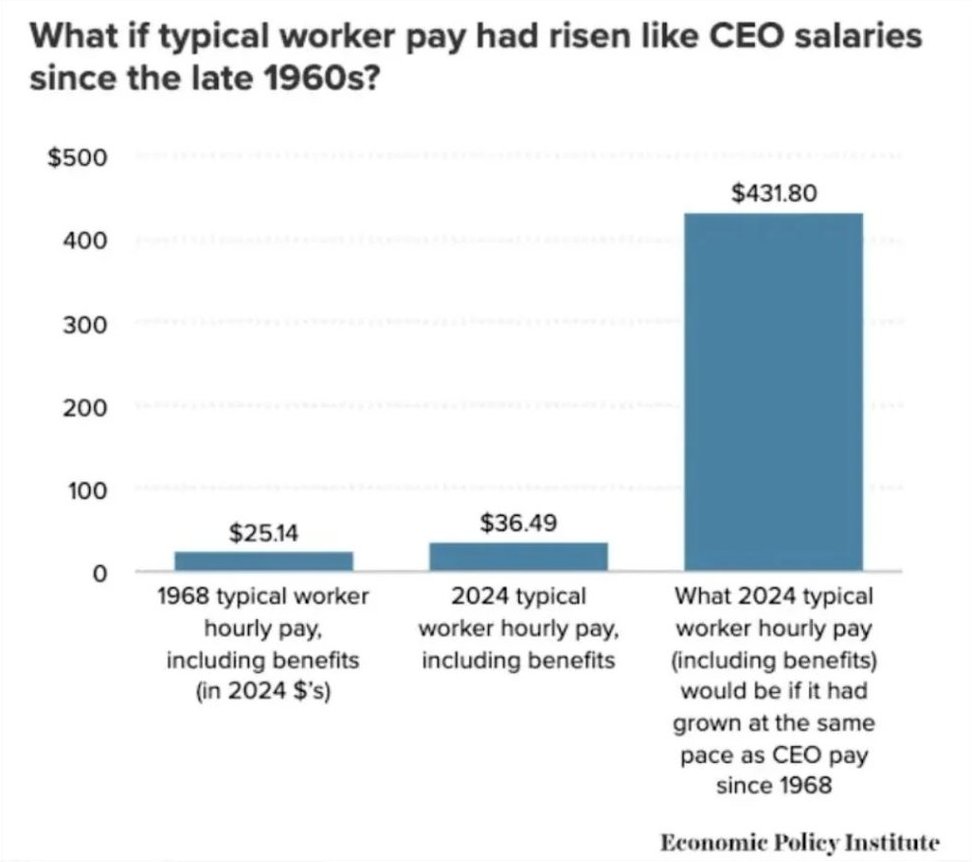
The $431-an-hour CEO pay chart checks out. Here's what it leaves out
EPI's newest data make the gap even bigger. But "CEO salaries" here means mostly stock, at the 350 biggest firms.
The bottom line
The numbers follow from EPI's own data1, and with EPI's partly projected 2025 figures the hypothetical bar passes $500 an hour. What the chart leaves out: "CEO salaries" are mostly stock payouts at the 350 largest firms2, and how much typical pay grew depends on how you measure it. The real fight is over why CEO pay rose.
The claims
What the post says or clearly implies, checked one by one. How verdicts work
Typical worker pay was $25.14 an hour in 1968 and $36.49 in 2024, and would be $431.80 if it had grown like CEO pay.
Checks outThe figures closely match EPI's published data. The choice of inflation measure can't change the $431.80 bar, and EPI's newest data, partly projected for 2025, push it past $500.
EPI puts typical worker compensation, wages plus benefits, at $53,000 in 1968 and $76,000 in 2024, in 2025 dollars. Divided by 2,080 work hours, that's about $25.50 and $36.50 an hour1. Realized pay for CEOs of the 350 largest firms went from $1.37 million to $24.5 million over the same years, roughly 18-fold. Multiply the 1968 worker figure by that and you get about $4551. The chart's slightly lower $431.80 likely reflects EPI's 2025 release, the latest data when these figures circulated in a February 2026 video citing EPI3,4.
A common objection is the inflation measure. It doesn't matter for the big bar: $431.80 is 1968 pay times CEO pay growth, and the inflation adjustment cancels out. The deflator only changes how much the middle bar grew.
The gap has since widened. With EPI's 2025 figures, partly projected from filings through August, the same math gives roughly $520 an hour, against an actual $371.
CEO salaries have risen about 18-fold since the late 1960s.
Missing contextBig-company CEO pay really did soar, under either of EPI's measures. But it isn't salary and it isn't typical CEOs: it's mostly stock, at the 350 largest firms, and it moves with the stock market.
EPI measures total pay for CEOs of the 350 largest U.S. firms by sales. In 2025, salary was $1.38 million of the $27.9 million average, and 82% came from stock awards and options2,5. That's the very top: the median salaried chief executive across all employers earned $213,990 in May 2025, BLS says6.
The "realized" measure counts stock when it vests or is cashed in, often years after it was awarded, so it rises with share prices2,7. That isn't the whole story: EPI's "granted" measure, which values stock when it's awarded, grew about 17-fold from 1968 to 2024, close to the realized measure's 18-fold1.
EPI's own comparison starts in 1978: realized CEO pay rose 1,316% while the S&P 500 rose 1,428% after inflation2. From the chart's 1968 start through 2025, CEO pay grew faster than stocks: about 20-fold against 8-fold, by our calculation from EPI's data, including its projected 2025 figure1. Either way, most of the growth came as stock.
Next to the CEO bar, typical worker pay looks like it has barely grown since 1968.
Missing contextTypical pay grew, slowly: about 45% after inflation since 1968 on EPI's measure. Some economists' measures show more growth, though even EPI's critics agree median pay has lagged productivity since the 1970s.
The chart's own bars show a 45% real rise. EPI's measure covers production and nonsupervisory workers, roughly 80% of private-sector workers, and already includes benefits, so the usual "wages leave out health insurance" objection doesn't apply8. By EPI's count, that pay rose 32.7% from late 1979 to mid-2026 while net productivity rose 93.7%8.
Measurement choices move the number. Economist Bruce Sacerdote found that wage series showing zero real growth since the 1970s are driven in part by the CPI-U. Correcting for estimated CPI bias gives about 1% a year from 1975 to 20159. EPI already uses gentler inflation indexes, so that critique hits its 45% less. Scott Winship of AEI finds that average pay across the whole workforce has tracked productivity10.
Winship also finds the core pattern: median pay has grown much more slowly than productivity since the early 1970s10. The dispute is over how big the lag is, not whether it exists.
The real disagreement
Facts can't settle this part, so we don't rule on it.
Is soaring pay for big-company CEOs a fair price for running far larger firms, or a sign executives are capturing gains that should be shared?
Both sides accept that pay at the very top grew far faster than typical pay2,11. They split on why it happened, and on whether a market outcome is fair when the gap gets this wide.
CEO pay reflects bargaining power
Executives gained power over the boards that pay them while policy weakened workers' bargaining power, so the gap is a choice that different policies could change.
Typical pay stopped tracking productivity around 1979. Since then productivity has grown 2.9 times as much as typical pay8. That followed choices that weakened workers' bargaining power: falling union membership, a minimum wage that lost value, and tax rules that favor the top8,12. When workers lose bargaining power, the gains go to profits and top salaries.
Boards can't be expected to bargain at arm's length with the executives they oversee, so managers wield substantial influence over their own pay13. Economists Josh Bivens and Lawrence Mishel argue that much of the rise in top pay is rent: income beyond what it takes to get someone to do the job12. Big-firm CEOs went from earning 2.6 times the average top-0.1% earner in 1965–1978 to 7.5 times in 2023, a jump a pure talent story struggles to explain3. Different choices could share gains more widely without hurting growth.
CEO pay tracks the value of running bigger firms
Pay at the top rose because the companies grew enormously, and a small edge in leadership at a giant firm is worth a great deal to shareholders.
In a competitive market for executives, pay should move with firm size. Xavier Gabaix and Augustin Landier found that the sixfold rise in CEO pay from 1980 to 2003 can be fully explained by the sixfold rise in the market value of large U.S. companies14. Steven Kaplan found that, as of 2012, big-company CEO pay relative to firm value was about where it was in the late 1970s, though above its long-run average, that technology and scale lifted other top earners too, and that boards oust CEOs after poor stock returns. In 2011's first say-on-pay votes, shareholders backed pay plans at over 98% of big companies11.
The chart compares leaders of the 350 biggest firms with everyone else and reads a market result as a policy failure. Typical pay has grown more than the gloomiest measures show, and the way to raise it is faster productivity growth10,9.
Where they agree
What would change minds
- Evidence on whether CEO pay rises with gains the CEO didn't cause, like industry-wide stock swings, would test the talent story against the power story.
- An agreed pay series, same workers, same inflation measure, wages plus benefits, would shrink the fight over how much typical pay grew.
- Studies of whether firms that give shareholders or workers more say over executive pay end up performing better or worse.
Sources
Every source was opened and read. Advocacy groups are labeled as such.
Show all 14 sources
- 1
- 2
- 3
- 4
- 5
- 6
- 7
- 8
- 9
- 10
- 11
- 12
- 13
- 14
Think we got something wrong? Email editor@viewfromthegallery.com with a source. Corrections are made openly and logged on the page.
Get new breakdowns by email
New breakdowns in your inbox: what was true, what wasn't, and what the argument is really about. No ads, no spin.