Economy · Elections

Stocks' worst day since April 2025, not one of the worst in history

Trump blamed the midterms. Analysts tied it to fears Democrats will curb data centers, but stocks rallied on the same results a day earlier.

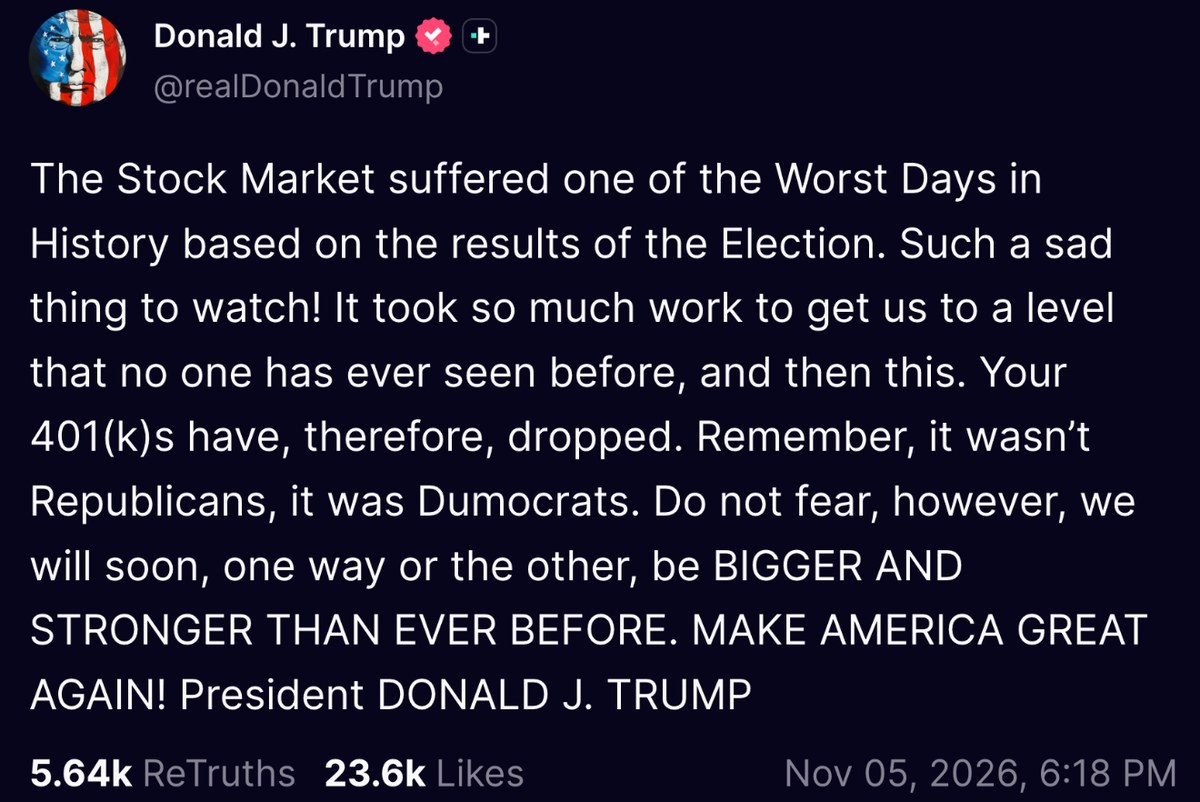
· @realDonaldTrumpThe post we're checking
The Stock Market suffered one of the Worst Days in History based on the results of the Election. Such a sad thing to watch! It took so much work to get us to a level that no one has ever seen before, and then this. Your 401(k)s have, therefore, dropped. Remember, it wasn’t Republicans, it was Dumocrats. Do not fear, however, we will soon, one way or the other, be BIGGER AND STRONGER THAN EVER BEFORE. MAKE AMERICA GREAT AGAIN! President DONALD J. TRUMP
Screenshot from Truth Social, taken Nov. 6. Shown for commentary.
Read the post as text
The Stock Market suffered one of the Worst Days in History based on the results of the Election. Such a sad thing to watch! It took so much work to get us to a level that no one has ever seen before, and then this. Your 401(k)s have, therefore, dropped. Remember, it wasn’t Republicans, it was Dumocrats. Do not fear, however, we will soon, one way or the other, be BIGGER AND STRONGER THAN EVER BEFORE. MAKE AMERICA GREAT AGAIN! President DONALD J. TRUMP
Posted Nov 5, 2026About 5.6K ReTruths and 23.6K likes on Truth Social as of Nov. 6, and covered by Fox Business. A similar X post by @BullTheoryio drew about 2.2M views.See the original

The bottom line

The S&P 500's 4.4% drop Thursday was its worst since April 2025. The Dow fell 3.4%, against 22.6% in 1987. Analysts tied the slide to fears Democrats will curb data centers. Stocks had jumped on the same results a day earlier, and tech stocks were already in a correction. The S&P is still up 7.4% this year.

The claims

What the post says or clearly implies, checked one by one. How verdicts work

1

The stock market "suffered one of the Worst Days in History" on Nov. 5.

Misleading

Its 334.89-point drop was the S&P 500's largest in at least a decade of data, by our calculation. By percentage, it was the worst day since April 2025, and the S&P had 10 worse days in that decade1,2.

The Dow fell 1,833.06 points, or 3.44%, the S&P 500 4.36% and the Nasdaq 5.52%3. All three had their worst day since April 4, 20251.

The Dow fell 22.6% on Oct. 19, 19874. In FRED's 10 years of daily data, 10 S&P 500 days fell further than Thursday, by our calculation2. In late morning, Yahoo Finance reported the Dow was "heading for its worst second session after a midterm election in data going back to its start in 1896," and the S&P 500 for its worst such session in data going back nearly a century, past a 2002 drop of about 2.3%5. The S&P closed down 4.36%.

In points, it was the S&P 500's largest drop in at least a decade of data, and the Dow's sixth-largest, by our calculation2,6. Near records, each 1% is more points. A viral X post said $2.5 trillion vanished "in just 60 minutes"7. An hour after the open, Yahoo Finance put losses at "roughly $2 trillion"5.
2

The drop was "based on the results of the Election": "it wasn't Republicans, it was Dumocrats."

Missing context

Analysts widely tied the slide to fears Democrats will restrict data centers. Stocks had rallied the day before as uncertainty lifted, and tech stocks (the Nasdaq-100) were already in a correction before the vote, amid AI-spending worries8.

"The obvious catalyst for the sharp selloff is that markets are pricing in the midterm results, after yesterday saw markets rise across the board as the political risk premium unwound," an eToro analyst told Fox Business3. The trigger "appears to be the concern that the Democrats ... will seek to regulate the AI industry and restrict data center development," Capital Economics wrote9.

On Wednesday, with the results known, the Dow gained 1,569.40 points, its best day since April 202510. Other indexes "surged after the election results eased uncertainty about who will control Washington," though Nvidia fell 3.2%9. At Thursday's close the S&P 500 was 2.84% below its Election Day close, the Nasdaq 4.17% and the Dow 0.51%, by our calculation2,11,6.

The Nasdaq-100 entered a correction Nov. 2, the day before the vote, on worries that AI spending was "outpacing near-term cash generation"8. An E*TRADE executive said "visible cracks in the AI ecosystem" showed even during Wednesday's rally9. Fox Business noted worries about the borrowing behind the AI boom12.

3

"Your 401(k)s have, therefore, dropped."

Missing context

Stock funds did fall: the S&P 500 is 2.8% below its Election Day close. It's still up 7.4% this year and 8.2% from a year ago, by our calculation2.

The S&P 500 closed Thursday at 7,353.733. That's its lowest close since July 29, and 5.95% below its Oct. 6 record, by our calculation from FRED's data2. Bonds, which many 401(k)s also hold, gained as the 10-year Treasury yield fell to 4.84% from 4.90%13.

Longer views look different. The index is up 7.42% since the end of 2025 and 8.20% since Nov. 5, 2025. This year the Dow is up 7.20% and the Nasdaq 4.62%, by our calculation2,6,11.

Trump's Thursday post14 followed one on Wednesday, during the rally: "Your 401(k)s are through the roof"15.

The S&P 500 fell 4.4% Thursday and is still up 7.4% this year

6K6.5K7K7.5K8K2026End of 2025: 6,846Oct. 6 record: 7,819Nov. 5: 7,354

Daily closing values as FRED publishes them from S&P Dow Jones Indices, Dec. 31, 2025 to Nov. 4, 2026. Market holidays have no value and are left out. The Nov. 5 close (7,353.73) is from Fox Business and matches FRED's Nov. 4 close minus the reported 334.89-point drop.

Daily closes of the S&P 500 from FRED2. FRED hadn't posted Nov. 5 by Nov. 6, so that close is from Fox Business3. Percentages are our calculation. The index excludes dividends.
Show the numbers
The S&P 500 fell 4.4% Thursday and is still up 7.4% this year: the numbers
DateS&P 500 close
Dec. 31, 20256,846
Jan. 2, 20266,858
Jan. 5, 20266,902
Jan. 6, 20266,945
Jan. 7, 20266,921
Jan. 8, 20266,921
Jan. 9, 20266,966
Jan. 12, 20266,977
Jan. 13, 20266,964
Jan. 14, 20266,927
Jan. 15, 20266,944
Jan. 16, 20266,940
Jan. 20, 20266,797
Jan. 21, 20266,876
Jan. 22, 20266,913
Jan. 23, 20266,916
Jan. 26, 20266,950
Jan. 27, 20266,979
Jan. 28, 20266,978
Jan. 29, 20266,969
Jan. 30, 20266,939
Feb. 2, 20266,976
Feb. 3, 20266,918
Feb. 4, 20266,883
Feb. 5, 20266,798
Feb. 6, 20266,932
Feb. 9, 20266,965
Feb. 10, 20266,942
Feb. 11, 20266,941
Feb. 12, 20266,833
Feb. 13, 20266,836
Feb. 17, 20266,843
Feb. 18, 20266,881
Feb. 19, 20266,862
Feb. 20, 20266,910
Feb. 23, 20266,838
Feb. 24, 20266,890
Feb. 25, 20266,946
Feb. 26, 20266,909
Feb. 27, 20266,879
March 2, 20266,882
March 3, 20266,817
March 4, 20266,870
March 5, 20266,831
March 6, 20266,740
March 9, 20266,796
March 10, 20266,781
March 11, 20266,776
March 12, 20266,673
March 13, 20266,632
March 16, 20266,699
March 17, 20266,716
March 18, 20266,625
March 19, 20266,606
March 20, 20266,506
March 23, 20266,581
March 24, 20266,556
March 25, 20266,592
March 26, 20266,477
March 27, 20266,369
March 30, 20266,344
March 31, 20266,529
April 1, 20266,575
April 2, 20266,583
April 6, 20266,612
April 7, 20266,617
April 8, 20266,783
April 9, 20266,825
April 10, 20266,817
April 13, 20266,886
April 14, 20266,967
April 15, 20267,023
April 16, 20267,041
April 17, 20267,126
April 20, 20267,109
April 21, 20267,064
April 22, 20267,138
April 23, 20267,108
April 24, 20267,165
April 27, 20267,174
April 28, 20267,139
April 29, 20267,136
April 30, 20267,209
May 1, 20267,230
May 4, 20267,201
May 5, 20267,259
May 6, 20267,365
May 7, 20267,337
May 8, 20267,399
May 11, 20267,413
May 12, 20267,401
May 13, 20267,444
May 14, 20267,501
May 15, 20267,409
May 18, 20267,403
May 19, 20267,354
May 20, 20267,433
May 21, 20267,446
May 22, 20267,473
May 26, 20267,519
May 27, 20267,520
May 28, 20267,564
May 29, 20267,580
June 1, 20267,600
June 2, 20267,610
June 3, 20267,554
June 4, 20267,584
June 5, 20267,384
June 8, 20267,406
June 9, 20267,387
June 10, 20267,267
June 11, 20267,394
June 12, 20267,431
June 15, 20267,554
June 16, 20267,511
June 17, 20267,420
June 18, 20267,501
June 22, 20267,473
June 23, 20267,365
June 24, 20267,358
June 25, 20267,357
June 26, 20267,354
June 29, 20267,440
June 30, 20267,499
July 1, 20267,483
July 2, 20267,483
July 6, 20267,537
July 7, 20267,504
July 8, 20267,483
July 9, 20267,544
July 10, 20267,575
July 13, 20267,515
July 14, 20267,544
July 15, 20267,572
July 16, 20267,534
July 17, 20267,458
July 20, 20267,443
July 21, 20267,509
July 22, 20267,499
July 23, 20267,408
July 24, 20267,412
July 27, 20267,413
July 28, 20267,429
July 29, 20267,316
July 30, 20267,438
July 31, 20267,490
Aug. 3, 20267,601
Aug. 4, 20267,737
Aug. 5, 20267,724
Aug. 6, 20267,710
Aug. 7, 20267,758
Aug. 10, 20267,753
Aug. 11, 20267,728
Aug. 12, 20267,749
Aug. 13, 20267,799
Aug. 14, 20267,786
Aug. 17, 20267,745
Aug. 18, 20267,692
Aug. 19, 20267,708
Aug. 20, 20267,641
Aug. 21, 20267,674
Aug. 24, 20267,653
Aug. 25, 20267,677
Aug. 26, 20267,676
Aug. 27, 20267,731
Aug. 28, 20267,712
Aug. 31, 20267,686
Sept. 1, 20267,631
Sept. 2, 20267,667
Sept. 3, 20267,748
Sept. 4, 20267,719
Sept. 8, 20267,674
Sept. 9, 20267,636
Sept. 10, 20267,592
Sept. 11, 20267,657
Sept. 14, 20267,620
Sept. 15, 20267,586
Sept. 16, 20267,552
Sept. 17, 20267,638
Sept. 18, 20267,651
Sept. 21, 20267,765
Sept. 22, 20267,765
Sept. 23, 20267,706
Sept. 24, 20267,704
Sept. 25, 20267,743
Sept. 28, 20267,684
Sept. 29, 20267,671
Sept. 30, 20267,652
Oct. 1, 20267,666
Oct. 2, 20267,723
Oct. 5, 20267,774
Oct. 6, 20267,819
Oct. 7, 20267,802
Oct. 8, 20267,765
Oct. 9, 20267,812
Oct. 12, 20267,807
Oct. 13, 20267,805
Oct. 14, 20267,719
Oct. 15, 20267,744
Oct. 16, 20267,659
Oct. 19, 20267,691
Oct. 20, 20267,713
Oct. 21, 20267,757
Oct. 22, 20267,663
Oct. 23, 20267,624
Oct. 26, 20267,677
Oct. 27, 20267,723
Oct. 28, 20267,744
Oct. 29, 20267,720
Oct. 30, 20267,580
Nov. 2, 20267,541
Nov. 3, 20267,569
Nov. 4, 20267,689
Nov. 5, 20267,354

The real disagreement

Facts can't settle this part, so we don't rule on it.

Should presidents and voters treat the stock market as a scorecard for elections and policy?

Thursday's selloff hit AI and chip stocks hardest. Nvidia alone lost more than $440 billion in market value1. The policy investors feared, limits on data centers, isn't a one-party worry: voters across parties are wary of AI and of data centers' effect on power bills, AP reported13.

Markets are a fast, real-money verdict

Most families own stock, and markets price the effects of elections and policy faster than any other gauge.

Most Americans have money riding on the market. The Fed's 2022 survey found 58% of families owned stock, directly or through funds and retirement accounts16. U.S. retirement assets reached $51.2 trillion in June, a third of household financial assets17.

Markets also absorb policy news faster than polls or official data. Economists studying the 2016 election found stock moves "reflect investor expectations on economic growth, taxes, and trade policy": banks and heavy industry did better, drugmakers worse18. Another team, using prediction markets, estimated that electing a Republican president raised stock values 2–3%19. The same team found stock values rise, slightly, with Republican control of Congress20. Presidents of both parties keep this score. Biden touted a "record stock market, record high 401(k)s" in 202421.

The market is a poor scorecard

Stock prices track expected profits for shareholders, who are mostly well-off, not how most Americans will fare.

Ownership is lopsided. The top 10% of households held about 88% of stocks and mutual funds outside 401(k)-type plans in mid-2026, the bottom half 0.6%. Of 401(k)-type plan assets, the top 10% held 55.6%, bottom half 4.8%22. Prices track expected profits. One study traces 40% of stocks' 1989–2017 rise to a shift of rewards to shareholders, "primarily at the expense of labor compensation"23. Voters, meanwhile, blame data centers for rising power bills13.

Daily moves are noisy. A classic study found it hard to explain more than a third of market swings with macroeconomic news24. Predictions tied to elections often miss. On election night 2016, Paul Krugman wrote that a first-pass answer to when markets would recover was "never"25. The S&P 500 rose 1.1% that day2. Trump said in 2020 the market would crash if Biden won, and it hit a record that month26.

Where they agree

  • One day's move is a weak guide to a retirement account held for decades.
  • Wariness about data centers' effect on power bills crosses party lines13.

What would change minds

  • Whether the new Democratic majorities and governors actually limit data-center construction, and how AI stocks trade when they do.
  • AI companies' next earnings reports, which will show whether the slump reflects politics or the business itself.

Sources

Every source was opened and read. Advocacy groups are labeled as such.

Show all 26 sources
  1. 1
  2. 2
    S&P 500 (SP500), daily close
    Federal Reserve Bank of St. Louis (FRED), from S&P Dow Jones Indices2026-11-05DataCovers 10 years of daily closes, Nov. 7, 2016 onward. Nov. 5, 2026 not yet posted when we downloaded it on Nov. 6.
  3. 3
  4. 4
    Stock Market Crash of 1987
    Federal Reserve History2013-11-22Research
  5. 5
  6. 6
    Dow Jones Industrial Average (DJIA), daily close
    Federal Reserve Bank of St. Louis (FRED), from S&P Dow Jones Indices2026-11-05DataCovers 10 years of daily closes.
  7. 7
    "$2,500,000,000,000 wiped out from the US stock market in just 60 minutes"
    @BullTheoryio on X2026-11-05Primary documentPosted 11:22 a.m. ET. About 2.2M views and 280K followers as of Nov. 6.
  8. 8
  9. 9
  10. 10
  11. 11
    NASDAQ Composite Index (NASDAQCOM), daily close
    Federal Reserve Bank of St. Louis (FRED), from Nasdaq2026-11-05Data
  12. 12
  13. 13
  14. 14
    Donald J. Trump, Truth Social post, Nov. 5, 2026, 6:18 p.m. EST
    Truth Social2026-11-05Primary documentOpened in a browser Nov. 6. Also archived at trumpstruth.org/statuses/43491.
  15. 15
    Donald J. Trump, Truth Social post, Nov. 4, 2026, 12:27 p.m. EST
    Trump's Truth (archive of Truth Social)2026-11-04Primary documentArchive of Trump's Truth Social posts, a project of Defending Democracy Together. Original: truthsocial.com/@realDonaldTrump/117559346773956882.
  16. 16
  17. 17
    Retirement Assets Total $51.2 Trillion in Second Quarter 2026
    Investment Company Institute2026-09-17DataTrade group for mutual funds and other regulated funds
  18. 18
    Company Stock Reactions to the 2016 Election Shock: Trump, Taxes and Trade
    National Bureau of Economic Research (Wagner, Zeckhauser and Ziegler)2017-02Research
  19. 19
    Partisan Impacts on the Economy: Evidence from Prediction Markets and Close Elections
    National Bureau of Economic Research (Snowberg, Wolfers and Zitzewitz)2006-03Research
  20. 20
    Party Influence in Congress and the Economy
    National Bureau of Economic Research (Snowberg, Wolfers and Zitzewitz)2006-12Research
  21. 21
  22. 22
    Distributional Financial Accounts: distribution of household wealth, 2026:Q2
    Federal Reserve Board2026DataOur calculation from the Fed's downloadable levels data, 2026:Q2: each group's holdings of "corporate equities and mutual fund shares" (which excludes stocks held in defined-contribution plans; IRAs are included) and of "DC pension entitlements" (401(k)-type plans and annuities sold directly to individuals), divided by the total.
  23. 23
    How the Wealth Was Won: Factor Shares as Market Fundamentals
    Journal of Political Economy (Greenwald, Lettau and Ludvigson)2025Research
  24. 24
    What Moves Stock Prices?
    National Bureau of Economic Research (Cutler, Poterba and Summers)1988Research
  25. 25
    Paul Krugman: The Economic Fallout
    The New York Times2016-11-09JournalismOpinion column, posted 12:42 a.m. ET Nov. 9, 2016.
  26. 26

Think we got something wrong? Email editor@viewfromthegallery.com with a source. Corrections are made openly and logged on the page.